
数据可视化基础(九):示例——球员能力图
·
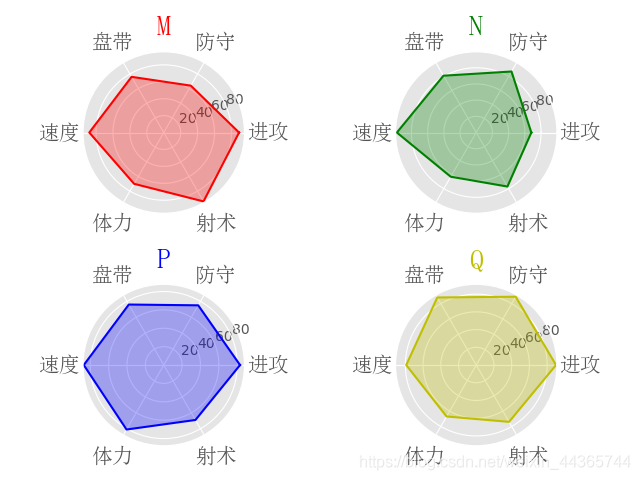
目标图形
球员能力图=四个能力子图
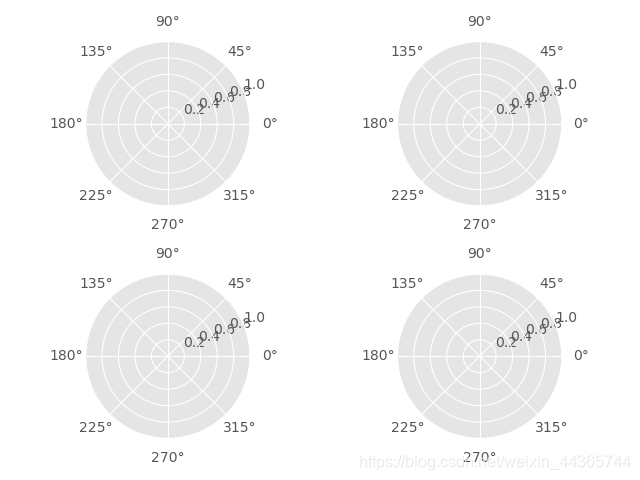
基础布局
import numpy as np
import matplotlib.pyplot as plt

plt.style.use('ggplot')

ax1=plt.subplot(221,projection='polar')
ax2=plt.subplot(222,projection='polar')
ax3=plt.subplot(223,projection='polar')
ax4=plt.subplot(224,projection='polar')
能力
设置能力数量和能力标签
ability_size=6
ability_label=['进攻','防守','盘带','速度','体力','射术']
子图绘制
极坐标闭合图,首尾相接
首尾相连
生成角度值
平分成6份
theta = np.linspace(0, 2 * np.pi, 6, endpoint=False)
追加值
theta = np.append(theta, theta[0])
player['M'] = np.append(player['M'], player['M'][0])
player['N'] = np.append(player['N'], player['N'][0])
player['H'] = np.append(player['H'], player['H'][0])
player['Q'] = np.append(player['Q'], player['Q'][0])
绘制label
去除角度,添加角度标志
绘制能力图形,进行填充
ax1.plot(theta,player['M'],'r')
ax1.fill(theta,player['M'],'r',alpha=0.3)

#角度标志label
ax1.set_xticks(theta)
ax1.set_xticklabels(ability_label,y=-0.05, fontproperties=font)
ax1.set_title('M', fontproperties=font, color='r', size=20)
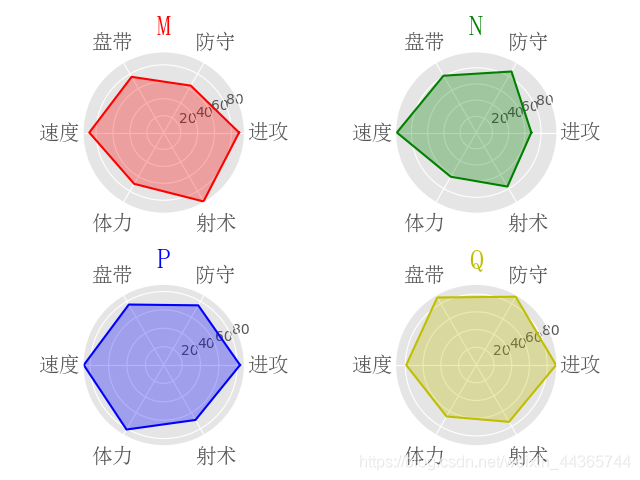
demo代码及最终结果
#_*_ coding:utf-8 _*_
import numpy as np
import matplotlib.pyplot as plt
from matplotlib.font_manager import FontProperties

plt.style.use('ggplot')

#字体
font = FontProperties(fname=r'C:\Windows\Fonts\SIMSUN.ttc', size=15)
ability_size=6
ability_label=[u'进攻',u'防守',u'盘带',u'速度',u'体力',u'射术']

ax1=plt.subplot(221,projection='polar')
ax2=plt.subplot(222,projection='polar')
ax3=plt.subplot(223,projection='polar')
ax4=plt.subplot(224,projection='polar')

#设置能力值
player={
    'M': np.random.randint(size=ability_size, low=60, high=99),
    'N': np.random.randint(size=ability_size, low=60, high=99),
    'P': np.random.randint(size=ability_size, low=60, high=99),
    'Q': np.random.randint(size=ability_size, low=60, high=99)
}


#首位相连
## 生成角度值
theta = np.linspace(0, 2 * np.pi, 6, endpoint=False)
## 追加值
theta = np.append(theta, theta[0])
player['M'] = np.append(player['M'], player['M'][0])
player['N'] = np.append(player['N'], player['N'][0])
player['P'] = np.append(player['P'], player['P'][0])
player['Q'] = np.append(player['Q'], player['Q'][0])

#绘制子图
##############1
ax1.plot(theta,player['M'],'r')
ax1.fill(theta,player['M'],'r',alpha=0.3)
ax1.set_xticks(theta)
ax1.set_xticklabels(ability_label,y=-0.05, fontproperties=font)
ax1.set_title('M', fontproperties=font, color='r', size=20)

##############2
ax2.plot(theta,player['N'],'g')
ax2.fill(theta,player['N'],'g',alpha=0.3)
ax2.set_xticks(theta)
ax2.set_xticklabels(ability_label,y=-0.05, fontproperties=font)
ax2.set_title('N', fontproperties=font, color='g', size=20)

##############3
ax3.plot(theta,player['P'],'b')
ax3.fill(theta,player['P'],'b',alpha=0.3)
ax3.set_xticks(theta)
ax3.set_xticklabels(ability_label,y=-0.05, fontproperties=font)
ax3.set_title('P', fontproperties=font, color='b', size=20)

##############4
ax4.plot(theta,player['Q'],'y')
ax4.fill(theta,player['Q'],'y',alpha=0.3)
ax4.set_xticks(theta)
ax4.set_xticklabels(ability_label,y=-0.05, fontproperties=font)
ax4.set_title('Q', fontproperties=font, color='y', size=20)

plt.show()
更多推荐

 0
0 0
0- 0


 已为社区贡献2条内容

所有评论(0)