
【LangGraph】Agent Supervisor:多代理监督者(Multi-agent supervisor)示例
多代理监督者(Multi-agent supervisor)
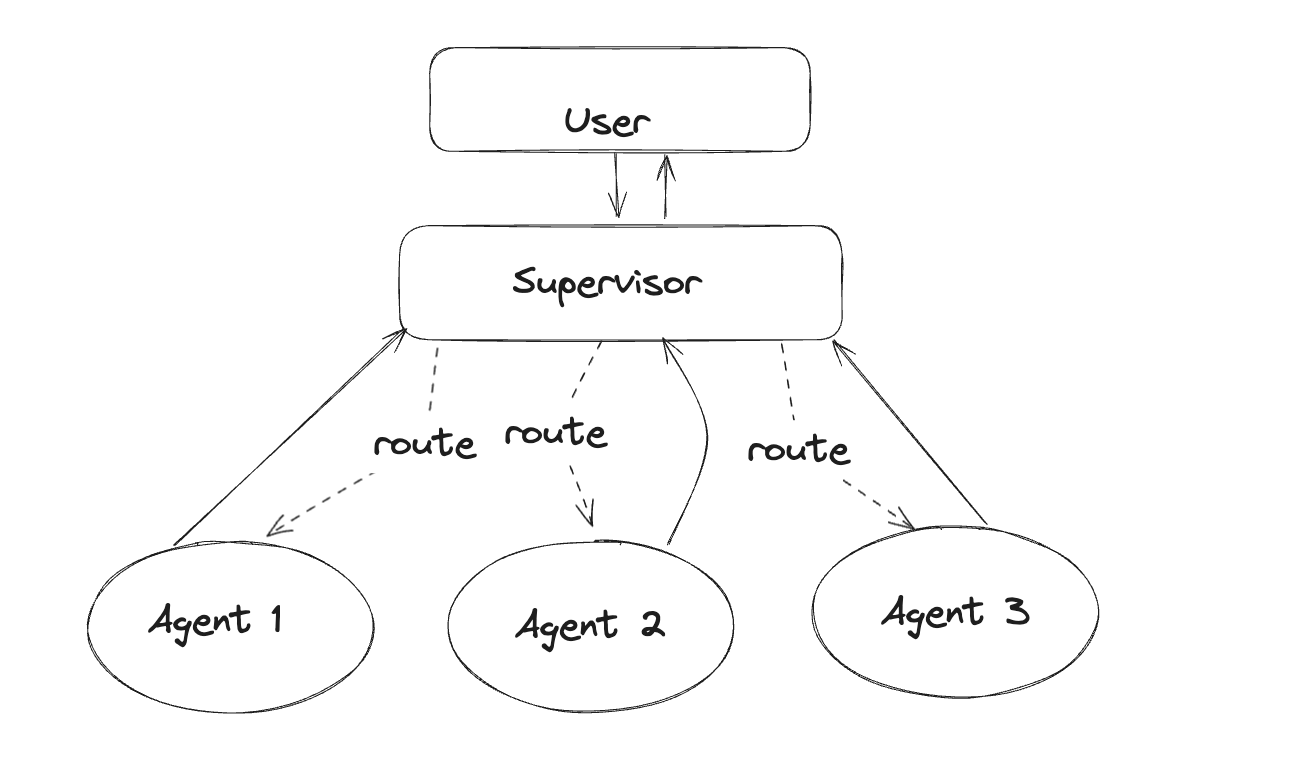
监督者(Supervisor)是一种多代理架构,其中专门的代理由一个中央监督者代理协调。监督者代理控制所有通信流和任务分配,根据当前上下文和任务需求决定调用哪个代理。
在本教程中,将构建一个包含两个代理——研究专家和数学专家的监督者系统。通过本教程,你将:
- 构建专门的研究和数学代理
- 使用预构建的
langgraph-supervisor构建一个协调它们的监督者 - 从头开始构建一个监督者
- 实现高级任务分配
设置
首先,让我们安装所需的软件包并设置 API 密钥:
pip install -U langgraph langgraph-supervisor langchain-tavily "langchain[openai]"
import getpass
import os

def _set_if_undefined(var: str):
    if not os.environ.get(var):
        os.environ[var] = getpass.getpass(f"请提供你的 {var}")

_set_if_undefined("OPENAI_API_KEY")
_set_if_undefined("TAVILY_API_KEY")
设置 LangSmith 以进行 LangGraph 开发
注册 LangSmith 以快速发现问题并提升 LangGraph 项目的性能。LangSmith 允许你使用跟踪数据来调试、测试和监控使用 LangGraph 构建的 LLM 应用程序——了解如何开始的更多信息请见此处。
1. 创建工作代理
首先,让我们创建专门的工作代理——研究代理和数学代理:
- 研究代理将使用 Tavily API 访问网络搜索工具
- 数学代理将访问简单的数学工具(
add、multiply、divide)
研究代理
对于网络搜索,我们将使用 langchain-tavily 的 TavilySearch 工具:
API 参考:TavilySearch
from langchain_tavily import TavilySearch

web_search = TavilySearch(max_results=3)
web_search_results = web_search.invoke("纽约市市长是谁?")

print(web_search_results["results"][0]["content"])
埃里克·亚当斯市长为纽约市人民服务,曾担任纽约市警察局警官、州参议员、布鲁克林区长,现在是纽约市第110任市长。他代表五个行政区的多元化工人家庭联盟发声,领导着恢复纽约市经济、减少不平等、改善公共安全、建设一个更强大、更健康的城市,为所有纽约人服务的斗争。埃里克·亚当斯市长为纽约市人民服务,曾担任纽约市警察局警官、州参议员、布鲁克林区长,现在是纽约市第110任市长。NYC 是纽约市的商标和服务标志。
为了创建独立的工作代理,我们将使用 LangGraph 的预构建代理。
API 参考:create_react_agent
from langgraph.prebuilt import create_react_agent

research_agent = create_react_agent(
    model="openai:gpt-4.1",
    tools=[web_search],
    prompt=(
        "你是一个研究代理。\n\n"
        "指令:\n"
        "- 仅协助与研究相关的任务,禁止执行任何数学任务\n"
        "- 任务完成后,直接向监督者回应\n"
        "- 仅返回你的工作结果,不包含任何其他文本"
    ),
    name="research_agent",
)
让我们运行代理以验证其行为是否符合预期。
我们将使用
pretty_print_messages辅助函数来美化流式输出的代理结果:from langchain_core.messages import convert_to_messages def pretty_print_message(message, indent=False): pretty_message = message.pretty_repr(html=True) if not indent: print(pretty_message) return indented = "\n".join("\t" + c for c in pretty_message.split("\n")) print(indented) def pretty_print_messages(update, last_message=False): is_subgraph = False if isinstance(update, tuple): ns, update = update # 跳过父图更新以避免冗余输出 if len(ns) == 0: return graph_id = ns[-1].split(":")[0] print(f"来自子图 {graph_id} 的更新:") print("\n") is_subgraph = True for node_name, node_update in update.items(): update_label = f"来自节点 {node_name} 的更新:" if is_subgraph: update_label = "\t" + update_label print(update_label) print("\n") messages = convert_to_messages(node_update["messages"]) if last_message: messages = messages[-1:] for m in messages: pretty_print_message(m, indent=is_subgraph) print("\n")
for chunk in research_agent.stream(
    {"messages": [{"role": "user", "content": "纽约市市长是谁?"}]}
):
    pretty_print_messages(chunk)
来自节点 agent 的更新:

================================== AI 消息 ==================================
名称: research_agent
工具调用:
  tavily_search (call_T4wrj7DKAG5hVtNVhjRYGdei)
 调用 ID: call_T4wrj7DKAG5hVtNVhjRYGdei
  参数:
    query: current mayor of New York City

来自节点 tools 的更新:

================================= 工具消息 =================================
名称: tavily_search

{"query": "current mayor of New York City", "follow_up_questions": null, "answer": null, "images": [], "results": [{"title": "List of mayors of New York City - Wikipedia", "url": "https://en.wikipedia.org/wiki/List_of_mayors_of_New_York_City", "content": "The mayor of New York City is the chief executive of the Government of New York City, as stipulated by New York City's charter.The current officeholder, the 110th in the sequence of regular mayors, is Eric Adams, a member of the Democratic Party.. During the Dutch colonial period from 1624 to 1664, New Amsterdam was governed by the Director of New Netherland.", "score": 0.9039154, "raw_content": null}, {"title": "Office of the Mayor | Mayor's Bio | City of New York - NYC.gov", "url": "https://www.nyc.gov/office-of-the-mayor/bio.page", "content": "Mayor Eric Adams has served the people of New York City as an NYPD officer, State Senator, Brooklyn Borough President, and now as the 110th Mayor of the City of New York. He gave voice to a diverse coalition of working families in all five boroughs and is leading the fight to bring back New York City's economy, reduce inequality, improve", "score": 0.8405867, "raw_content": null}, {"title": "Eric Adams - Wikipedia", "url": "https://en.wikipedia.org/wiki/Eric_Adams", "content": "Eric Leroy Adams (born September 1, 1960) is an American politician and former police officer who has served as the 110th mayor of New York City since 2022. Adams was an officer in the New York City Transit Police and then the New York City Police Department (NYPD) for more than 20 years, retiring at the rank of captain.He served in the New York State Senate from 2006 to 2013, representing the", "score": 0.77731717, "raw_content": null}], "response_time": 1.31}

来自节点 agent 的更新:

================================== AI 消息 ==================================
名称: research_agent

纽约市现任市长是埃里克·亚当斯。
数学代理
对于数学代理的工具,我们将使用普通的 Python 函数:
def add(a: float, b: float):
    """加法:将两个数字相加。"""
    return a + b

def multiply(a: float, b: float):
    """乘法:将两个数字相乘。"""
    return a * b

def divide(a: float, b: float):
    """除法:将两个数字相除。"""
    return a / b

math_agent = create_react_agent(
    model="openai:gpt-4.1",
    tools=[add, multiply, divide],
    prompt=(
        "你是一个数学代理。\n\n"
        "指令:\n"
        "- 仅协助与数学相关的任务\n"
        "- 任务完成后,直接向监督者回应\n"
        "- 仅返回你的工作结果,不包含任何其他文本"
    ),
    name="math_agent",
)
让我们运行数学代理:
for chunk in math_agent.stream(
    {"messages": [{"role": "user", "content": "(3 + 5) x 7 的结果是多少?"}]}
):
    pretty_print_messages(chunk)
来自节点 agent 的更新:

================================== AI 消息 ==================================
名称: math_agent
工具调用:
  add (call_LqyOrR1Ktr2LVLDlXpbWNAsp)
 调用 ID: call_LqyOrR1Ktr2LVLDlXpbWNAsp
  参数:
    a: 3
    b: 5

来自节点 tools 的更新:

================================= 工具消息 =================================
名称: add

8.0

来自节点 agent 的更新:

================================== AI 消息 ==================================
名称: math_agent
工具调用:
  multiply (call_IBXYtlEMdZrfDZ8g8bWC31pM)
 调用 ID: call_IBXYtlEMdZrfDZ8g8bWC31pM
  参数:
    a: 8
    b: 7

来自节点 tools 的更新:

================================= 工具消息 =================================
名称: multiply

56.0

来自节点 agent 的更新:

================================== AI 消息 ==================================
名称: math_agent

56
2. 使用 langgraph-supervisor 创建监督者
为了实现我们的多代理系统,我们将使用预构建的 langgraph-supervisor 库中的 create_supervisor:
API 参考:create_supervisor | init_chat_model
from langgraph_supervisor import create_supervisor
from langchain.chat_models import init_chat_model

supervisor = create_supervisor(
    model=init_chat_model("openai:gpt-4.1"),
    agents=[research_agent, math_agent],
    prompt=(
        "你是一个管理两个代理的监督者:\n"
        "- 研究代理:将研究相关任务分配给此代理\n"
        "- 数学代理:将数学相关任务分配给此代理\n"
        "一次仅分配工作给一个代理,不并行调用代理。\n"
        "不要自己执行任何工作。"
    ),
    add_handoff_back_messages=True,
    output_mode="full_history",
).compile()
from IPython.display import display, Image

display(Image(supervisor.get_graph().draw_mermaid_png()))

现在让我们用一个需要两个代理的查询来运行它:
- 研究代理将查找所需的 GDP 信息
- 数学代理将执行除法以找到纽约州 GDP 占美国 GDP 的百分比,如请求所示
for chunk in supervisor.stream(
    {
        "messages": [
            {
                "role": "user",
                "content": "查找 2024 年美国和纽约州的 GDP。纽约州占美国 GDP 的百分比是多少?",
            }
        ]
    },
):
    pretty_print_messages(chunk, last_message=True)

final_message_history = chunk["supervisor"]["messages"]
来自节点 supervisor 的更新:

================================= 工具消息 =================================
名称: transfer_to_research_agent

成功转移到 research_agent

来自节点 research_agent 的更新:

================================= 工具消息 =================================
名称: transfer_back_to_supervisor

成功转移回 supervisor

来自节点 supervisor 的更新:

================================= 工具消息 =================================
名称: transfer_to_math_agent

成功转移到 math_agent

来自节点 math_agent 的更新:

================================= 工具消息 =================================
名称: transfer_back_to_supervisor

成功转移回 supervisor

来自节点 supervisor 的更新:

================================== AI 消息 ==================================
名称: supervisor

2024 年美国 GDP 为 29.017 万亿美元,纽约州 GDP 为 2.284 万亿美元。纽约州大约占美国 GDP 的 7.87%。
3. 从头开始创建监督者
现在让我们从头开始实现相同的多代理系统。我们需要:
设置代理通信
我们需要定义监督者代理与工作代理通信的方式。在多代理架构中,通常通过交接(handoffs)实现这一点,其中一个代理将控制权交给另一个代理。交接允许你指定:
- 目标:要转移到的目标代理
- 负载:要传递给该代理的信息
我们将通过交接工具实现交接,并将这些工具提供给监督者代理:当监督者调用这些工具时,它将把控制权交给工作代理,并将完整的消息历史传递给该代理。
API 参考:tool | InjectedToolCallId | InjectedState | StateGraph | START | Command
from typing import Annotated
from langchain_core.tools import tool, InjectedToolCallId
from langgraph.prebuilt import InjectedState
from langgraph.graph import StateGraph, START, MessagesState
from langgraph.types import Command

def create_handoff_tool(*, agent_name: str, description: str | None = None):
    name = f"transfer_to_{agent_name}"
    description = description or f"请求 {agent_name} 协助。"

    @tool(name, description=description)
    def handoff_tool(
        state: Annotated[MessagesState, InjectedState],
        tool_call_id: Annotated[str, InjectedToolCallId],
    ) -> Command:
        tool_message = {
            "role": "tool",
            "content": f"成功转移到 {agent_name}",
            "name": name,
            "tool_call_id": tool_call_id,
        }
        return Command(
            goto=agent_name,  # (1)!
            update={**state, "messages": state["messages"] + [tool_message]},  # (2)!
            graph=Command.PARENT,  # (3)!
        )

    return handoff_tool

# 交接
assign_to_research_agent = create_handoff_tool(
    agent_name="research_agent",
    description="将任务分配给研究代理。",
)

assign_to_math_agent = create_handoff_tool(
    agent_name="math_agent",
    description="将任务分配给数学代理。",
)
说明:
- 要交接到的代理或节点的名称。
- 获取代理的消息并将其添加到父状态中,作为交接的一部分。下一个代理将看到父状态。
- 指示 LangGraph 需要导航到父多代理图中的代理节点。
创建监督者代理
然后,让我们使用刚刚定义的交接工具创建监督者代理。我们将使用预构建的 create_react_agent:
supervisor_agent = create_react_agent(
    model="openai:gpt-4.1",
    tools=[assign_to_research_agent, assign_to_math_agent],
    prompt=(
        "你是一个管理两个代理的监督者:\n"
        "- 研究代理:将研究相关任务分配给此代理\n"
        "- 数学代理:将数学相关任务分配给此代理\n"
        "一次仅分配工作给一个代理,不并行调用代理。\n"
        "不要自己执行任何工作。"
    ),
    name="supervisor",
)
创建多代理图
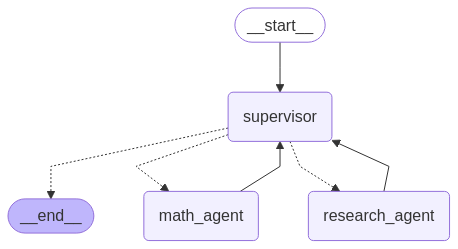
将所有这些整合起来,让我们为整个多代理系统创建一个图。我们将监督者和各个代理添加为子图节点。
API 参考:END
from langgraph.graph import END

# 定义多代理监督者图
supervisor = (
    StateGraph(MessagesState)
    # 注意:`destinations` 仅用于可视化,不影响运行时行为
    .add_node(supervisor_agent, destinations=("research_agent", "math_agent", END))
    .add_node(research_agent)
    .add_node(math_agent)
    .add_edge(START, "supervisor")
    # 始终返回到监督者
    .add_edge("research_agent", "supervisor")
    .add_edge("math_agent", "supervisor")
    .compile()
)
请注意,我们为工作代理添加了显式的边,指向返回到监督者——这意味着它们保证将控制权交回监督者。如果你希望代理直接回应用户(即将系统变成路由器),可以移除这些边。
from IPython.display import display, Image

display(Image(supervisor.get_graph().draw_mermaid_png()))
创建了多代理图后,现在让我们运行它!
for chunk in supervisor.stream(
    {
        "messages": [
            {
                "role": "user",
                "content": "查找 2024 年美国和纽约州的 GDP。纽约州占美国 GDP 的百分比是多少?",
            }
        ]
    },
):
    pretty_print_messages(chunk, last_message=True)

final_message_history = chunk["supervisor"]["messages"]
来自节点 supervisor 的更新:

================================= 工具消息 =================================
名称: transfer_to_research_agent

成功转移到 research_agent

来自节点 research_agent 的更新:

================================== AI 消息 ==================================
名称: research_agent

- 2024 年美国 GDP:29.017 万亿美元(名义,当前价格)
- 2024 年纽约州 GDP:2.284 万亿美元
- 2024 年纽约州占美国 GDP 的比例:7.87%

来自节点 supervisor 的更新:

================================= 工具消息 =================================
名称: transfer_to_math_agent

成功转移到 math_agent

来自节点 math_agent 的更新:

================================== AI 消息 ==================================
名称: math_agent

2024 年美国 GDP:29.017 万亿美元
2024 年纽约州 GDP:2.284 万亿美元
纽约州占美国 GDP 的比例:7.87%

来自节点 supervisor 的更新:

================================== AI 消息 ==================================
名称: supervisor

2024 年美国 GDP 为 29.017 万亿美元。2024 年纽约州 GDP 为 2.284 万亿美元。纽约州 GDP 大约占美国 GDP 的 7.87%。
让我们检查完整的消息历史:
for message in final_message_history:
    message.pretty_print()
================================ 人类消息 =================================

查找 2024 年美国和纽约州的 GDP。纽约州占美国 GDP 的百分比是多少?
================================== AI 消息 ==================================
名称: supervisor
工具调用:
  transfer_to_research_agent (call_qxk9abrxWYQT6a9hPNpXiuM0)
 调用 ID: call_qxk9abrxWYQT6a9hPNpXiuM0
  参数:
================================= 工具消息 =================================
名称: transfer_to_research_agent

成功转移到 research_agent
================================== AI 消息 ==================================
名称: research_agent
工具调用:
  tavily_search (call_A3cVm1BXDD8dYv6uLwO132gg)
 调用 ID: call_A3cVm1BXDD8dYv6uLwO132gg
  参数:
    query: US GDP 2024
    search_depth: advanced
  tavily_search (call_77JyoUYwGDXlRNKOwvQFUUYJ)
 调用 ID: call_77JyoUYwGDXlRNKOwvQFUUYJ
  参数:
    query: New York state GDP 2024
    search_depth: advanced
================================= 工具消息 =================================
名称: tavily_search

{"query": "US GDP 2024", "follow_up_questions": null, "answer": null, "images": [], "results": [{"url": "https://tradingeconomics.com/united-states/gdp-growth", "title": "United States GDP Growth Rate - Trading Economics", "content": "The US economy expanded an annualized 2.4% in Q4 2024, slightly higher than 2.3% in the previous estimates, primarily reflecting a downward revision to imports. Exports fell slightly less (-0.2% vs -0.5%) and imports declined more than initially anticipated (-1.9% vs -1.2%), leaving the contribution from net trade positive at 0.26 pp (vs 0.12 pp). Government expenditure also rose more (3.1% vs 2.9%) and fixed investment contracted less (-1.1% vs -1.4%), due to equipment (-8.7% vs -9%) while [...] The Gross Domestic Product (GDP) in the United States expanded 2.40 percent in the fourth quarter of 2024 over the previous quarter. GDP Growth Rate in the United States averaged 3.21 percent from 1947 until 2024, reaching an all time high of 35.20 percent in the third quarter of 2020 and a record low of -28.10 percent in the second quarter of 2020. This page provides the latest reported value for - United States GDP Growth Rate - plus previous releases, historical high and low, short-term [...] The Gross Domestic Product (GDP) in the United States expanded 2.40 percent in the fourth quarter of 2024 over the previous quarter. GDP Growth Rate in the United States is expected to be 0.90 percent by the end of this quarter, according to Trading Economics global macro models and analysts expectations. In the long-term, the United States GDP Growth Rate is projected to trend around 2.00 percent in 2026, according to our econometric models.\n%\n3Y5Y10YMAX\nExport API\nOK\nLoading...", "score": 0.9071234, "raw_content": null}, {"url": "https://www.bea.gov/data/gdp/gross-domestic-product", "title": "Gross Domestic Product | U.S. Bureau of Economic Analysis (BEA)", "content": "Real gross domestic product (GDP) increased at an annual rate of 2.4 percent in the fourth quarter of 2024 (October, November, and December), according to the third estimate released by the U.S. Bureau of Economic Analysis. In the third quarter, real GDP increased 3.1 percent. The increase in real GDP in the fourth quarter primarily reflected increases in consumer spending and government spending that were partly offset by a decrease in investment. Imports, which are a subtraction in the", "score": 0.9008183, "raw_content": null}, {"url": "https://www.nerdwallet.com/article/finance/gdp-report", "title": "GDP Report: Final Estimate Shows Growth Increased 2.4% in Q4 2024", "content": "NerdWallet's content is fact-checked for accuracy, timeliness and relevance. It undergoes a thorough review process involving writers and editors to ensure the information is as clear and complete as possible.\n\nAnna Helhoski\n\nRick VanderKnyff\n\nUpdated on April 7\n\nReal gross domestic product increased by an annual rate of 2.4% in the fourth quarter of 2024, according to the third estimate report released on March 27 by the Bureau of Economic Analysis. [...] The third estimate also showed that in 2024, the U.S. GDP grew 2.8% compared to a 2.9% increase in 2023.\n\nQ1 2025 GDP forecasts are negative\n\nA forecasting tool published by the Atlanta Federal Reserve shows negative growth for the first quarter of 2025; it expects gross domestic product (GDP) to contract by rate of -2.8%, according to data released on March 28. If the forecast is correct, it would be the first quarter where GDP declined since the first and second quarters of 2022. [...] GDP could be the next concern: On March 3, a forecasting tool published by the Atlanta Federal Reserve showed that GDP could contract by a rate of -2.8% in the first quarter of 2025. If GDP does indeed decline, it would be the first time since the first and second quarters of 2022.\n\nIn 2024, the U.S. GDP grew 2.8% compared to a 2.9% increase in 2023, according to a second estimate of real gross domestic product from the Bureau of Economic Analysis, released Feb. 27.", "score": 0.89053273, "raw_content": null}], "response_time": 1.78}
================================= 工具消息 =================================
名称: tavily_search

{"query": "New York state GDP in 2024", "follow_up_questions": null, "answer": null, "images": [], "results": [{"url": "https://en.wikipedia.org/wiki/Economy_of_New_York_(state)", "title": "Economy of New York (state) - Wikipedia", "content": "Jump to content\nMain menu\nSearch\nDonate\nCreate account\nLog in\nPersonal tools\nToggle the table of contents\nEconomy of New York (state)\n1 language\nArticle\nTalk\nRead\nEdit\nView history\nTools\nFrom Wikipedia, the free encyclopedia\nThis article is about the overall economy of New York State. For the economy of New York City, see Economy of New York City.\nEconomy of New York\nNew York City, the economic capital of New York (state)\nStatistics\nGDP $2.3 trillion (2024)[1]\nGDP per capita  $117,332 (2024)[2] [...] The economy of the State of New York is reflected in its gross state product in 2024 of $2.284 trillion, ranking third in size behind the larger states of California and Texas. If New York State were an independent nation, it would rank as the 10th largest economy in the world by nominal GDP. However, in 2019, the multi-state, New York City-centered metropolitan statistical area produced a gross metropolitan product (GMP) of $US2.0 trillion, ranking first nationally by a wide margin and would [...] Population below poverty line   13.6%[3]\nGini coefficient    0.5157 ± 0.0029 (2023)[4]\nLabour force    9,645,984 (2023)[5]\nUnemployment    4.4% (August 2024)[6]\nPublic finances\nRevenues    $63.5 billion[7]\nExpenses    $54.6 billion[8]", "score": 0.9511106, "raw_content": null}, {"url": "https://en.wikipedia.org/wiki/List_of_U.S._states_and_territories_by_GDP", "title": "List of U.S. states and territories by GDP - Wikipedia", "content": "GDP per capita also varied widely throughout the United States in 2024, with New York ($117,332), Massachusetts ($110,561), and Washington (state) ($108,468) recording the three highest GDP per capita figures in the U.S., while Mississippi ($53,061), Arkansas ($60,276), and West Virginia ($60,783) recorded the three lowest GDP per capita figures in the U.S. The District of Columbia, though, recorded a GDP per capita figure far higher than any U.S. state in 2024 at $263,220. [...] Overall, in the calendar year 2024, the United States' Nominal GDP at Current Prices totaled at $29.017 trillion, as compared to $25.744 trillion in 2022.\nThe three U.S. states with the highest GDPs were California ($4.080 trillion), Texas ($2.695 trillion), and New York ($2.284 trillion). The three U.S. states with the lowest GDPs were Vermont ($45.4 billion), Wyoming ($53.0 billion), and Alaska ($69.8 billion).", "score": 0.8947989, "raw_content": null}, {"url": "https://edc.nyc/sites/default/files/2025-01/NYCEDC-State-of-the-NYC-Economy-2024-v3.pdf", "title": "[PDF] State of the New York City Economy - NYCEDC", "content": "for talent faced a limited supply. STATE OF THE NEW YORK CITY ECONOMY 2024 / 21 STATE OF THE NEW YORK CITY ECONOMY 2024 / 22 After losing nearly a million jobs during the COVID-19 pandemic, New York City is now at record-high levels of private and total employment. The city’s gross city product (GCP) stands at $1.18 trillion as of 2023.24 While legacy sectors such as Finance and Insurance have continued to play a vital part in the city’s economic successes, emerging sectors like Tech, the Green [...] STATE OF THE NEW YORK CITY ECONOMY 2024 / 11 New York City’s economy is the largest in the nation, with $2 trillion in gross metropolitan product (GMP) for the metro area, representing 9% of the total US economy. As such, the city’s economy is closely intertwined with the broader national economic landscape, and US macroeconomic conditions play a significant role in shaping the economic backdrop for the city. National interest rates, inflation, gross domestic product (GDP), and employment [...] 1 Macro Trends STATE OF THE NEW YORK CITY ECONOMY 2024 / 12 Output Has Grown Faster in NYC than Nationally Since 2022 Actual and Projected US Real GDP and NYC Real GCP Growth Rates 2019 2020 2021 2022 2023 2024* 2025* NYC 2.6% -4.2% 5.5% 2.6% 2.8% 3.6% 1.9% US 2.5% -2.2% 5.8% 1.9% 2.5% 2.5% 1.4% Source: NYC OMB and US Bureau of Economic Analysis. Projections for 2024 and and 2025 from NYC OMB.", "score": 0.85797083, "raw_content": null}], "response_time": 0.63}
================================== AI 消息 ==================================
名称: research_agent

- 2024 年美国 GDP:29.017 万亿美元(名义,当前价格)([来源](https://en.wikipedia.org/wiki/List_of_U.S._states_and_territories_by_GDP))。
- 2024 年纽约州 GDP:2.284 万亿美元([来源](https://en.wikipedia.org/wiki/Economy_of_New_York_(state)))。
- 2024 年纽约州占美国 GDP 的比例:大约 7.87%
================================== AI 消息 ==================================
名称: supervisor
工具调用:
  transfer_to_math_agent (call_m5ICqaoAtRXHWb8BI3638dJL)
 调用 ID: call_m5ICqaoAtRXHWb8BI3638dJL
  参数:
================================= 工具消息 =================================
名称: transfer_to_math_agent

成功转移到 math_agent
================================== AI 消息 ==================================
名称: math_agent
工具调用:
  divide (call_Sf7nvyvEgIaoDlaioPmkCdqz)
 调用 ID: call_Sf7nvyvEgIaoDlaioPmkCdqz
  参数:
    a: 2.284
    b: 29.017
================================= 工具消息 =================================
名称: divide

0.07871247889168417
================================== AI 消息 ==================================
名称: math_agent

2024 年美国 GDP:29.017 万亿美元
2024 年纽约州 GDP:2.284 万亿美元
纽约州占美国 GDP 的比例:7.87%
================================== AI 消息 ==================================
名称: supervisor

2024 年美国 GDP 为 29.017 万亿美元。2024 年纽约州 GDP 为 2.284 万亿美元。纽约州 GDP 大约占美国 GDP 的 7.87%。
重要说明
你可以看到,监督者系统将所有单个代理消息(即它们的内部工具调用循环)附加到完整消息历史中。这意味着在每次监督者轮次中,监督者代理会看到完整的历史。如果你想更精细地控制:
-
输入如何传递给代理:你可以使用 LangGraph 的
Send()原语在交接期间直接向工作代理发送数据。参见下面的任务分配示例。 -
代理输出如何添加:你可以通过将代理包装在单独的节点函数中,控制代理内部消息历史的多少被添加到总体监督者消息历史中:
def call_research_agent(state):
    # 返回代理的最终响应,
    # 不包括内部独白
    response = research_agent.invoke(state)
    return {"messages": response["messages"][-1]}
4. 创建分配任务
到目前为止,各个代理依赖于解析完整消息历史来确定它们的任务。另一种方法是要求监督者明确制定任务。我们可以通过向 handoff_tool 函数添加 task_description 参数来实现这一点。
API 参考:Send
from langgraph.types import Send

def create_task_description_handoff_tool(
    *, agent_name: str, description: str | None = None
):
    name = f"transfer_to_{agent_name}"
    description = description or f"请求 {agent_name} 协助。"

    @tool(name, description=description)
    def handoff_tool(
        # 由监督者 LLM 填充
        task_description: Annotated[
            str,
            "下一个代理应执行的任务描述,包括所有相关上下文。",
        ],
        # 这些参数被 LLM 忽略
        state: Annotated[MessagesState, InjectedState],
    ) -> Command:
        task_description_message = {"role": "user", "content": task_description}
        agent_input = {**state, "messages": [task_description_message]}
        return Command(
            goto=[Send(agent_name, agent_input)],
            graph=Command.PARENT,
        )

    return handoff_tool

assign_to_research_agent_with_description = create_task_description_handoff_tool(
    agent_name="research_agent",
    description="将任务分配给研究代理。",
)

assign_to_math_agent_with_description = create_task_description_handoff_tool(
    agent_name="math_agent",
    description="将任务分配给数学代理。",
)

supervisor_agent_with_description = create_react_agent(
    model="openai:gpt-4.1",
    tools=[
        assign_to_research_agent_with_description,
        assign_to_math_agent_with_description,
    ],
    prompt=(
        "你是一个管理两个代理的监督者:\n"
        "- 研究代理:将研究相关任务分配给此助手\n"
        "- 数学代理:将数学相关任务分配给此助手\n"
        "一次仅分配工作给一个代理,不并行调用代理。\n"
        "不要自己执行任何工作。"
    ),
    name="supervisor",
)

supervisor_with_description = (
    StateGraph(MessagesState)
    .add_node(
        supervisor_agent_with_description, destinations=("research_agent", "math_agent")
    )
    .add_node(research_agent)
    .add_node(math_agent)
    .add_edge(START, "supervisor")
    .add_edge("research_agent", "supervisor")
    .add_edge("math_agent", "supervisor")
    .compile()
)
注意
我们在 handoff_tool 中使用 Send() 原语。这意味着工作代理不会接收完整的 supervisor 图状态作为输入,而是仅看到 Send 负载的内容。在本例中,我们将任务描述作为一个单独的“人类”消息发送。
现在让我们使用相同的输入查询运行它:
for chunk in supervisor.stream(
    {
        "messages": [
            {
                "role": "user",
                "content": "查找 2024 年美国和纽约州的 GDP。纽约州占美国 GDP 的百分比是多少?",
            }
        ]
    },
    subgraphs=True,
):
    pretty_print_messages(chunk, last_message=True)
来自子图 supervisor 的更新:

    来自节点 agent 的更新:

    ================================== AI 消息 ==================================
    名称: supervisor
    工具调用:
      transfer_to_research_agent (call_TtKzjGQBe4X9Xh0VzmjStVgZ)
     调用 ID: call_TtKzjGQBe4X9Xh0VzmjStVgZ
      参数:

来自子图 research_agent 的更新:

    来自节点 agent 的更新:

    ================================== AI 消息 ==================================
    名称: research_agent
    工具调用:
      tavily_search (call_AfeRYBJxJtmD4EKqifYcx8EI)
     调用 ID: call_AfeRYBJxJtmD4EKqifYcx8EI
      参数:
        query: US GDP in 2024
        search_depth: advanced
      tavily_search (call_n7Dn8QnDLu2ZpEDzswS2MOJ8)
     调用 ID: call_n7Dn8QnDLu2ZpEDzswS2MOJ8
      参数:
        query: New York state GDP in 2024
        search_depth: advanced

来自子图 research_agent 的更新:

    来自节点 tools 的更新:

    ================================= 工具消息 =================================
    名称: tavily_search

    {"query": "New York state GDP in 2024", "follow_up_questions": null, "answer": null, "images": [], "results": [{"url": "https://en.wikipedia.org/wiki/Economy_of_New_York_(state)", "title": "Economy of New York (state) - Wikipedia", "content": "Jump to content\nMain menu\nSearch\nDonate\nCreate account\nLog in\nPersonal tools\nToggle the table of contents\nEconomy of New York (state)\n1 language\nArticle\nTalk\nRead\nEdit\nView history\nTools\nFrom Wikipedia, the free encyclopedia\nThis article is about the overall economy of New York State. For the economy of New York City, see Economy of New York City.\nEconomy of New York\nNew York City, the economic capital of New York (state)\nStatistics\nGDP $2.3 trillion (2024)[1]\nGDP per capita  $117,332 (2024)[2] [...] The economy of the State of New York is reflected in its gross state product in 2024 of $2.284 trillion, ranking third in size behind the larger states of California and Texas. If New York State were an independent nation, it would rank as the 10th largest economy in the world by nominal GDP. However, in 2019, the multi-state, New York City-centered metropolitan statistical area produced a gross metropolitan product (GMP) of $US2.0 trillion, ranking first nationally by a wide margin and would [...] Population below poverty line   13.6%[3]\nGini coefficient    0.5157 ± 0.0029 (2023)[4]\nLabour force    9,645,984 (2023)[5]\nUnemployment    4.4% (August 2024)[6]\nPublic finances\nRevenues    $63.5 billion[7]\nExpenses    $54.6 billion[8]", "score": 0.9530353, "raw_content": null}, {"url": "https://en.wikipedia.org/wiki/List_of_U.S._states_and_territories_by_GDP", "title": "List of U.S. states and territories by GDP - Wikipedia", "content": "GDP per capita also varied widely throughout the United States in 2024, with New York ($117,332), Massachusetts ($110,561), and Washington (state) ($108,468) recording the three highest GDP per capita figures in the U.S., while Mississippi ($53,061), Arkansas ($60,276), and West Virginia ($60,783) recorded the three lowest GDP per capita figures in the U.S. The District of Columbia, though, recorded a GDP per capita figure far higher than any U.S. state in 2024 at $263,220. [...] Overall, in the calendar year 2024, the United States' Nominal GDP at Current Prices totaled at $29.017 trillion, as compared to $25.744 trillion in 2022.\nThe three U.S. states with the highest GDPs were California ($4.080 trillion), Texas ($2.695 trillion), and New York ($2.284 trillion). The three U.S. states with the lowest GDPs were Vermont ($45.4 billion), Wyoming ($53.0 billion), and Alaska ($69.8 billion).", "score": 0.89997756, "raw_content": null}, {"url": "https://edc.nyc/sites/default/files/2025-01/NYCEDC-State-of-the-NYC-Economy-2024-v3.pdf", "title": "[PDF] State of the New York City Economy - NYCEDC", "content": "for talent faced a limited supply. STATE OF THE NEW YORK CITY ECONOMY 2024 / 21 STATE OF THE NEW YORK CITY ECONOMY 2024 / 22 After losing nearly a million jobs during the COVID-19 pandemic, New York City is now at record-high levels of private and total employment. The city’s gross city product (GCP) stands at $1.18 trillion as of 2023.24 While legacy sectors such as Finance and Insurance have continued to play a vital part in the city’s economic successes, emerging sectors like Tech, the Green [...] STATE OF THE NEW YORK CITY ECONOMY 2024 / 11 New York City’s economy is the largest in the nation, with $2 trillion in gross metropolitan product (GMP) for the metro area, representing 9% of the total US economy. As such, the city’s economy is closely intertwined with the broader national economic landscape, and US macroeconomic conditions play a significant role in shaping the economic backdrop for the city. National interest rates, inflation, gross domestic product (GDP), and employment [...] 1 Macro Trends STATE OF THE NEW YORK CITY ECONOMY 2024 / 12 Output Has Grown Faster in NYC than Nationally Since 2022 Actual and Projected US Real GDP and NYC Real GCP Growth Rates 2019 2020 2021 2022 2023 2024* 2025* NYC 2.6% -4.2% 5.5% 2.6% 2.8% 3.6% 1.9% US 2.5% -2.2% 5.8% 1.9% 2.5% 2.5% 1.4% Source: NYC OMB and US Bureau of Economic Analysis. Projections for 2024 and and 2025 from NYC OMB.", "score": 0.8616433, "raw_content": null}], "response_time": 2.35}

来自子图 research_agent 的更新:

    来自节点 agent 的更新:

    ================================== AI 消息 ==================================
    名称: research_agent

    - 2024 年美国 GDP 为 29.017 万亿美元(名义,当前价格)([来源](https://en.wikipedia.org/wiki/List_of_U.S._states_and_territories_by_GDP))。
    - 2024 年纽约州 GDP 为 2.284 万亿美元([来源](https://en.wikipedia.org/wiki/Economy_of_New_York_(state)))。

    2024 年纽约州占美国 GDP 的百分比:大约 7.9%。

来自子图 supervisor 的更新:

    来自节点 agent 的更新:

    ================================== AI 消息 ==================================
    名称: supervisor
    工具调用:
      transfer_to_math_agent (call_oYbIXhQQeTWlj2zvZSoStUgO)
     调用 ID: call_oYbIXhQQeTWlj2zvZSoStUgO
      参数:

来自子图 math_agent 的更新:

    来自节点 agent 的更新:

    ================================== AI 消息 ==================================
    名称: math_agent
    工具调用:
      divide (call_K5QxmkQYFfCZw5Vzkbz43VIG)
     调用 ID: call_K5QxmkQYFfCZw5Vzkbz43VIG
      参数:
        a: 2.284
        b: 29.017

来自子图 math_agent 的更新:

    来自节点 tools 的更新:

    ================================= 工具消息 =================================
    名称: divide

    0.07871247889168417

来自子图 math_agent 的更新:

    来自节点 agent 的更新:

    ================================== AI 消息 ==================================
    名称: math_agent

    2024 年纽约州 GDP 占美国 GDP 的比例大约为 7.87%。

来自子图 supervisor 的更新:

    来自节点 agent 的更新:

    ================================== AI 消息 ==================================
    名称: supervisor

    以下是结果:
    - 2024 年美国 GDP:29.017 万亿美元
    - 2024 年纽约州 GDP:2.284 万亿美元
    - 2024 年纽约州占美国 GDP 的比例:大约 7.87%。
5. 总结
- 多代理监督者机制:本教程展示了如何构建一个多代理系统,其中监督者代理协调专门的研究和数学代理,通过交接机制实现任务分配和通信。
- 核心步骤:
- 工作代理创建:
- 研究代理使用
TavilySearch工具进行网络搜索,专注于研究任务。 - 数学代理使用简单的 Python 数学函数(
add、multiply、divide),专注于数学计算。
- 研究代理使用
- 监督者实现:
- 使用
langgraph-supervisor的create_supervisor快速构建监督者,协调代理并管理任务流。 - 从头构建监督者,使用自定义交接工具和
StateGraph,实现更灵活的控制。
- 使用
- 任务分配:
- 默认交接通过消息历史传递任务,代理自行解析。
- 高级任务分配使用
Send原语和task_description,明确指定任务,减少代理的推理负担。
- 图结构:
- 监督者作为中央节点,工作代理作为子图节点,通过显式边确保控制权返回监督者。
- 可通过移除返回边将系统转换为路由器,使代理直接回应用户。
- 工作代理创建:
- 使用建议:
- 使用
prompt明确定义代理职责,避免任务重叠(如研究代理禁止执行数学任务)。 - 调整
output_mode和消息历史管理以优化性能,特别是在长对话中。 - 使用 LangSmith 跟踪和调试代理交互,优化任务分配和工具调用。
- 在生产环境中,考虑持久化存储(如 Redis)来管理状态,而不是仅依赖
MessagesState。
- 使用
- 注意事项:
- 确保
OPENAI_API_KEY和TAVILY_API_KEY正确设置以使用 OpenAI 模型和 Tavily 搜索。 - 监督者系统的消息历史可能随时间增长,需通过自定义节点函数(如
call_research_agent)控制输出。 - 如果需要更复杂的任务分配逻辑(如并行代理调用或动态代理选择),可扩展图结构。
- 确保
参考资料:
更多推荐


 30
 0
- 0


 已为社区贡献14条内容

所有评论(0)