
zabbix 使用 dataease 做数据大屏
·
创作灵感
近期,在平台看到,有人用dataease实现了zabbix的监控大屏。
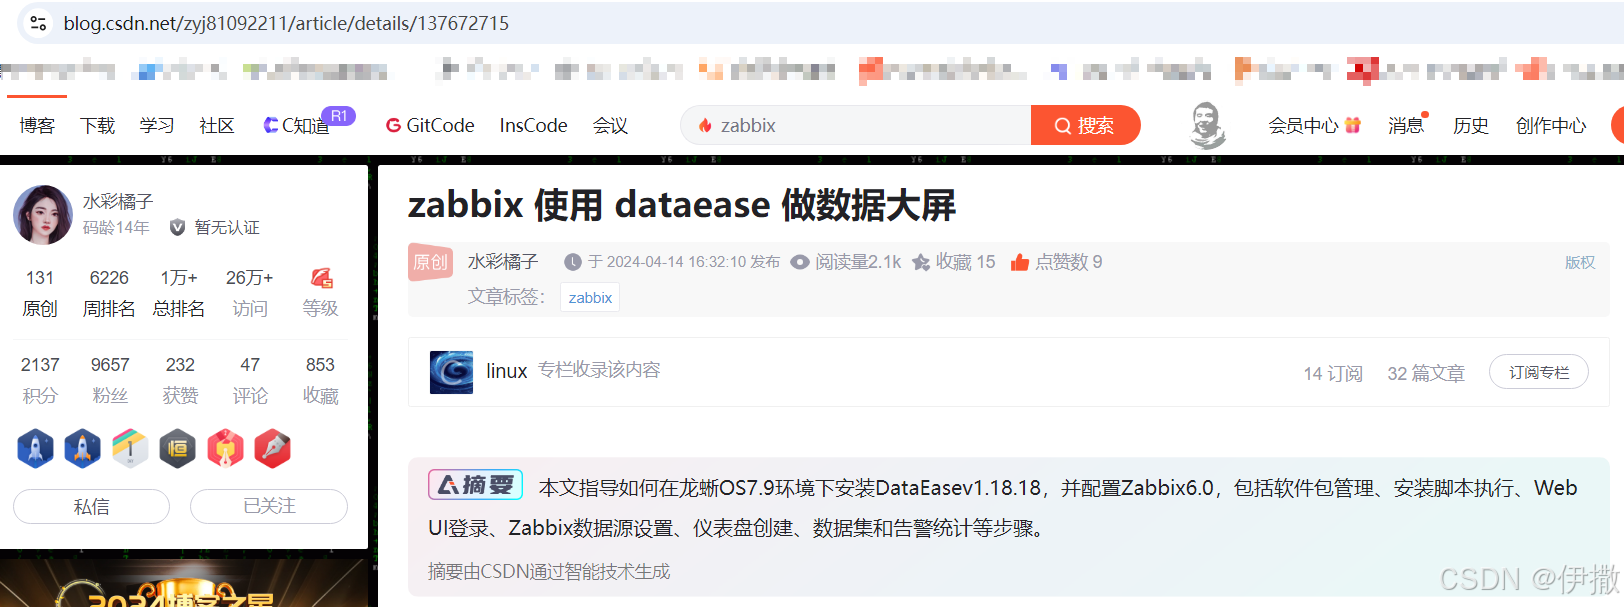
源文章在这里:zabbix 使用 dataease 做数据大屏_dataease zabbix-CSDN博客
以前使用过dataease,我对这个软件的评价就是:好,好,好。于是乎,我就按照博主的写的,开始了我的操作,过程中我发现,我按照博主给的sql脚本进行查询操作时,有些脚本执行不下去,后面发现博主使用的zabbix是6.0的版本,而我的是5.0的版本。
于是我根据博主的脚本,生成了能够适配这个大屏的zabbix5.0的数据查询脚本。
脚本如下,有需要的可以参考一下。
脚本
说明一下:
执行不下去的原因在hosts表上,available字段在这个表里,其他的都没变。
-- 主机组数量统计
select
	count(*) as 主机组数量
from
	hstgrp;

-- 主机数量统计
select
	count( distinct h.hostid ) as 主机数量
from
	hstgrp hg
	join hosts_groups hgh on hg.groupid = hgh.groupid
	join `hosts` h on hgh.hostid = h.hostid
where
	h.status = 0;

-- 可监控主机数量
select
	count( distinct h.hostid ) as 可监控主机
from
	hstgrp hg
	join hosts_groups hgh on hg.groupid = hgh.groupid
	join `hosts` h on hgh.hostid = h.hostid
	join interface i on h.hostid = i.hostid
where
	h.status = 0
	and h.available = 1;

-- 不可监控主机数量
select
	count( distinct h.hostid ) as 不可监控主机
from
	hstgrp hg
	join hosts_groups hgh on hg.groupid = hgh.groupid
	join `hosts` h on hgh.hostid = h.hostid
	join interface i on h.hostid = i.hostid
where
	h.status = 0
	and h.available = '2';

-- 未知监控主机数量统计
select
	count( distinct h.hostid ) as 未知监控主机
from
	hstgrp hg
	join hosts_groups hgh on hg.groupid = hgh.groupid
	join `hosts` h on hgh.hostid = h.hostid
	join interface i on h.hostid = i.hostid
where
	h.status = 0
	and h.available = 0;

-- 告警主机数量
select
	count( distinct h.hostid ) as 告警主机数量
from
	triggers t
	join problem p on t.triggerid = p.objectid
	join functions f on t.triggerid = f.triggerid
	join items it on f.itemid = it.itemid
	join `hosts` h on it.hostid = h.hostid
where
	p.r_eventid is null
	and h.status = 0;

-- 待处理警告数
select
	count( distinct p.eventid ) as 待处理警告数
from
	problem p
	join triggers t on p.objectid = t.triggerid
	join functions f on t.triggerid = f.triggerid
	join items i on f.itemid = i.itemid
	join `hosts` h on i.hostid = h.hostid
where
	p.r_eventid is null
	and p.acknowledged = 0;

--已处理警告数量
select
	count(*) as 已处理警告数量
from
	( select
	eventid
from
	problem
where
	acknowledged = 1 union all
select
	eventid
from
events
where
	severity = 0) as resolved_warnings;


-- 主机状态数量统计
select
	'可监控主机' as 主机状态,
	count( distinct case when h.available = 1 then h.hostid end ) as 数量
from
	hstgrp hg
	join hosts_groups hgh on hg.groupid = hgh.groupid
	join `hosts` h on hgh.hostid = h.hostid
	join interface i on h.hostid = i.hostid
where
	h.status = 0 union all
select
	'不可监控主机' as 主机状态,
	count( distinct case when h.available = 2 then h.hostid end ) as 数量
from
	hstgrp hg
	join hosts_groups hgh on hg.groupid = hgh.groupid
	join `hosts` h on hgh.hostid = h.hostid
	join interface i on h.hostid = i.hostid
where
	h.status = 0 union all
select
	'未知监控主机' as 主机状态,
	count( distinct case when h.available = 0 then h.hostid end ) as 数量
from
	hstgrp hg
	join hosts_groups hgh on hg.groupid = hgh.groupid
	join `hosts` h on hgh.hostid = h.hostid
	join interface i on h.hostid = i.hostid
where
	h.status = 0;

-- top 10 待处理问题数
select
	h.name as 主机名称,
	count( p.eventid ) as 问题数
from
	problem p
	left join (
	select
		s1.triggerid,
		( select s2.itemid from functions s2 where s2.triggerid = s1.triggerid limit 1 ) as itemid
	from
		functions s1
	group by
		s1.triggerid
	) as f on f.triggerid = p.objectid
	left join `items` as i on i.itemid = f.itemid
	left join `hosts` as h on h.hostid = i.hostid
	left join `interface` as inf on inf.hostid = h.hostid
where
	p.r_eventid is null
	and h.status = 0
	and i.status = 0
group by
	h.hostid,
	h.host
order by
	问题数 desc
	limit 10;

-- top 10 主机组告警数
select
	total_problems.主机组名,
	sum( total_problems.num_problems ) as 问题数
from
	(
	select
		hs.name as 主机组名,
		count( distinct p.eventid ) as num_problems
	from
		problem p
		left join (
		select
			s1.triggerid,
			( select s2.itemid from functions s2 where s2.triggerid = s1.triggerid limit 1 ) as itemid
		from
			functions s1
		group by
			s1.triggerid
		) as f on f.triggerid = p.objectid
		left join `items` as i on i.itemid = f.itemid
		left join `hosts` as h on h.hostid = i.hostid
		left join hosts_groups as hg on hg.hostid = h.hostid
		left join hstgrp as hs on hs.groupid = hg.groupid
	where
		isnull( p.r_eventid )
		and h.status = 0
		and i.`status` = 0
	group by
		hs.name
	) as total_problems
group by
	total_problems.主机组名
order by
	问题数 desc
	limit 10;

-- 主机组异常设备占比
select
	hg.groupid as '组id',
	coalesce ( hs.name, '无' ) as '组名',
	count( distinct case when p.eventid is not null then h.hostid end ) as '异常主机数量',
	count( distinct h.hostid ) as '总主机数量',
	concat(
		round(
			count( distinct case when p.eventid is not null then h.hostid end ) / count( distinct h.hostid ) * 100,
			2
		),
		'%'
	) as '异常主机占比'
from
	hosts_groups hg
	left join `hosts` h on hg.hostid = h.hostid
	left join hstgrp hs on hg.groupid = hs.groupid
	left join (
	select
		i.hostid,
		p.eventid
	from
		problem p
		join functions f on p.objectid = f.triggerid
		join items i on f.itemid = i.itemid
	where
		p.r_eventid is null
	) as p on h.hostid = p.hostid
where
	h.status = 0
group by
	hg.groupid,
	hs.name
order by
	hg.groupid;

-- 告警信息详细
select distinct
	e.clock,
	from_unixtime( e.clock ) as '告警时间',
	e.name as '告警名称',
	e.severity as '严重程度',
case
		e.severity
		when '0' then
		'未定义'
		when '1' then
		'信息'
		when '2' then
		'警告'
		when '3' then
		'一般严重'
		when '4' then
		'严重'
		when '5' then
		'灾难' else '未知'
	end as '严重程度名称',
	h.`host` as '主机名',
	h.`name` as '主机名显示',
	i.ip as 'ip地址'
from
	events e
	left join triggers t on e.objectid = t.triggerid
	left join functions f on t.triggerid = f.triggerid
	left join items it on f.itemid = it.itemid
	left join `hosts` h on it.hostid = h.hostid
	left join interface i on h.hostid = i.hostid
where
	e.source = 0
	and e.
value
	= 1
order by
	e.clock desc;


-- 报警级别数量统计
SELECT
    CASE
        WHEN p.severity = '0' THEN '未分类'
        WHEN p.severity = '1' THEN '信息'
        WHEN p.severity = '2' THEN '警告'
        WHEN p.severity = '3' THEN '一般严重'
        WHEN p.severity = '4' THEN '严重'
        WHEN p.severity = '5' THEN '灾难级'
    END AS severity_name,
    COUNT(*) AS num
FROM problem p
JOIN (
    SELECT triggerid, MIN(itemid) AS itemid
    FROM functions
    GROUP BY triggerid
) f ON p.objectid=f.triggerid
JOIN items i ON f.itemid=i.itemid
JOIN hosts h ON i.hostid=h.hostid
LEFT JOIN interface inf ON inf.hostid=h.hostid AND inf.main=1
WHERE p.r_clock=0
  AND h.status IN (0,1)
  AND i.status=0
  AND (inf.ip IS NULL OR inf.ip <> '127.0.0.1')
GROUP BY
    CASE
        WHEN p.severity = '0' THEN '未分类'
        WHEN p.severity = '1' THEN '信息'
        WHEN p.severity = '2' THEN '警告'
        WHEN p.severity = '3' THEN '一般严重'
        WHEN p.severity = '4' THEN '严重'
        WHEN p.severity = '5' THEN '灾难级'
    END,
    p.severity
ORDER BY CAST(p.severity AS SIGNED) DESC;
更多推荐


 5
5 0
0- 0


 已为社区贡献1条内容

所有评论(0)