
第十二章 数据可视化 - 动态柱状图
·
目录
基础柱状图
第一阶段-第十二章-01-基础柱状图构建_哔哩哔哩_bilibili
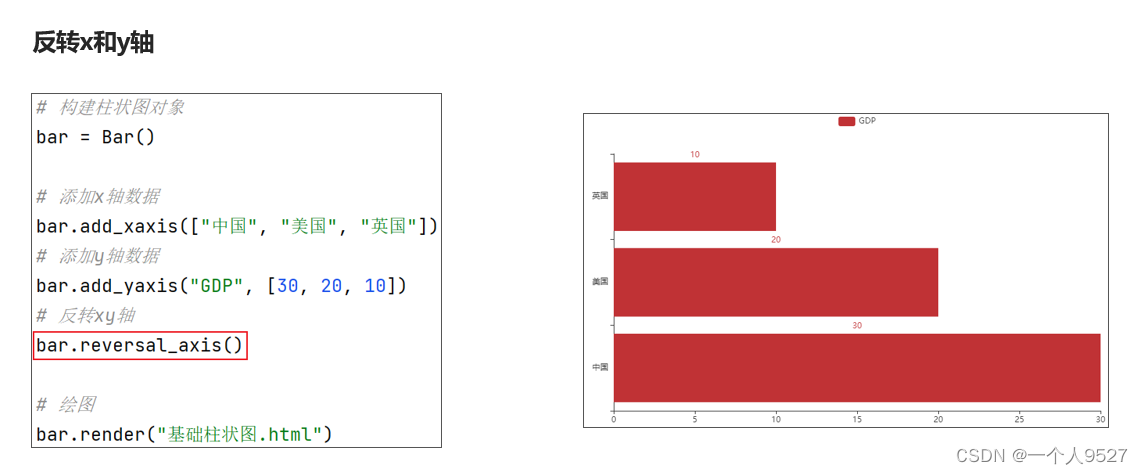
"""
演示基础柱状图的开发
"""
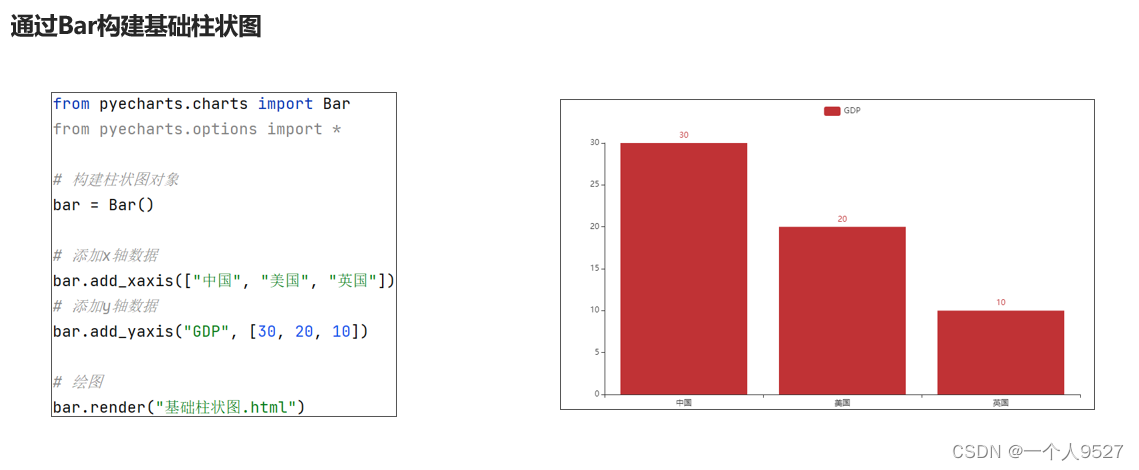
from pyecharts.charts import Bar
from pyecharts.options import LabelOpts
# 使用Bar构建基础柱状图
bar = Bar()
# 添加x轴的数据
bar.add_xaxis(["中国", "美国", "英国"])
# 添加y轴数据
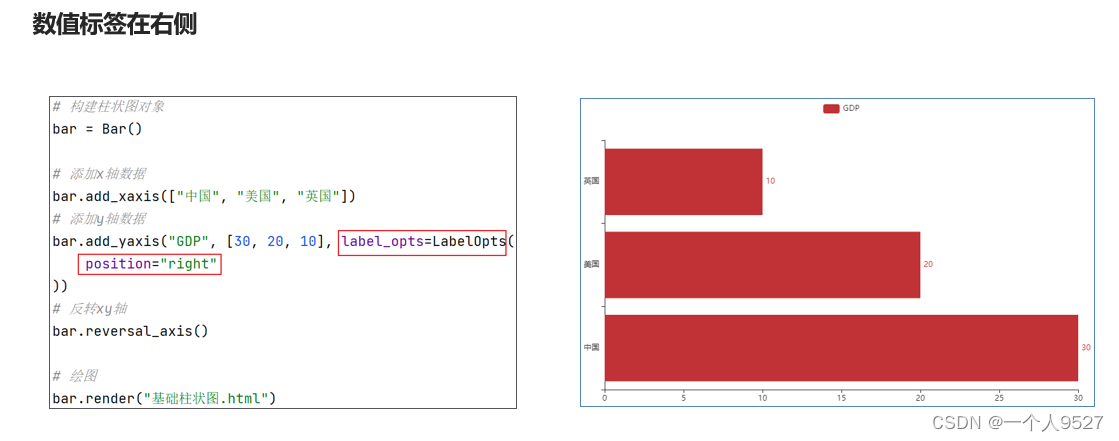
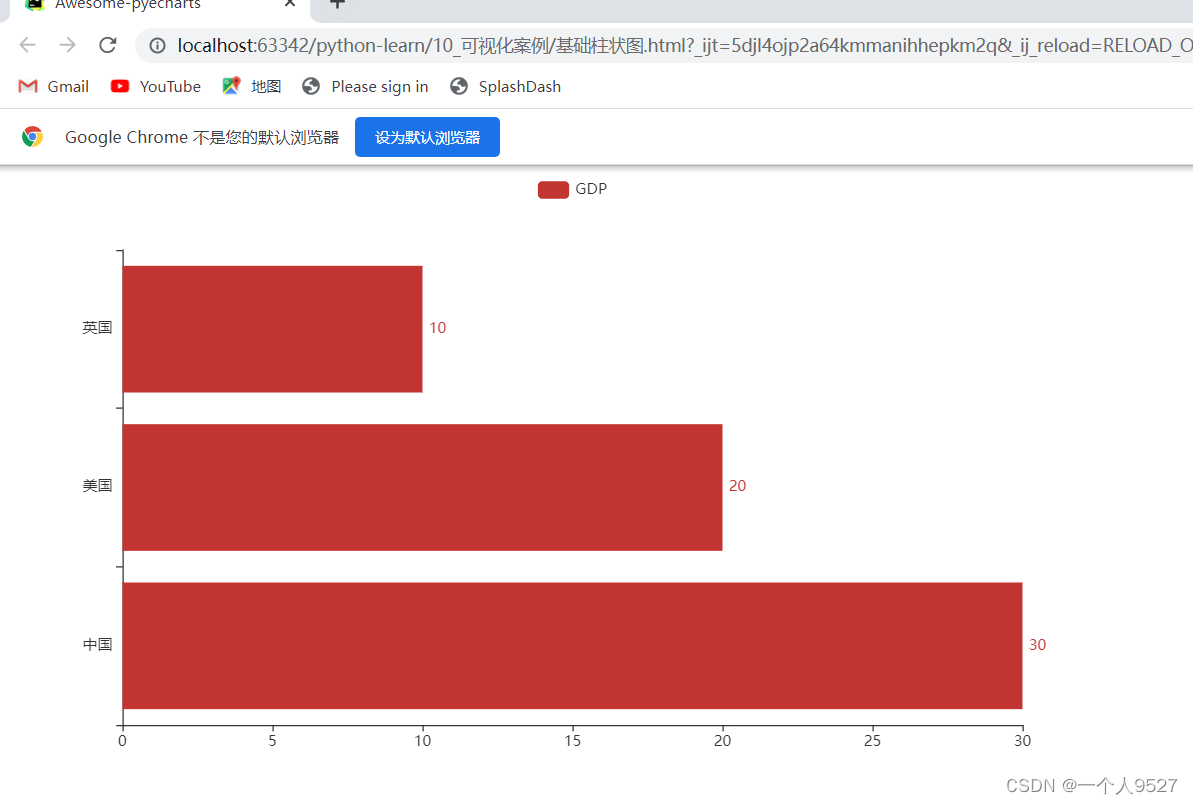
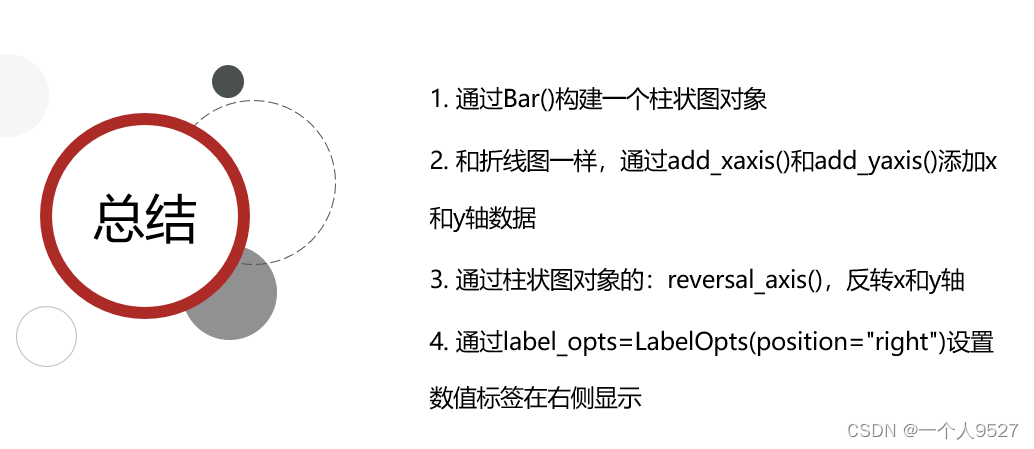
bar.add_yaxis("GDP", [30, 20, 10], label_opts=LabelOpts(position="right"))#设置数值标签30,20,10在右侧
# 反转x和y轴
bar.reversal_axis()
# 绘图
bar.render("基础柱状图.html")
基础时间线柱状图
第一阶段-第十二章-02-基础时间线柱状图绘制_哔哩哔哩_bilibili
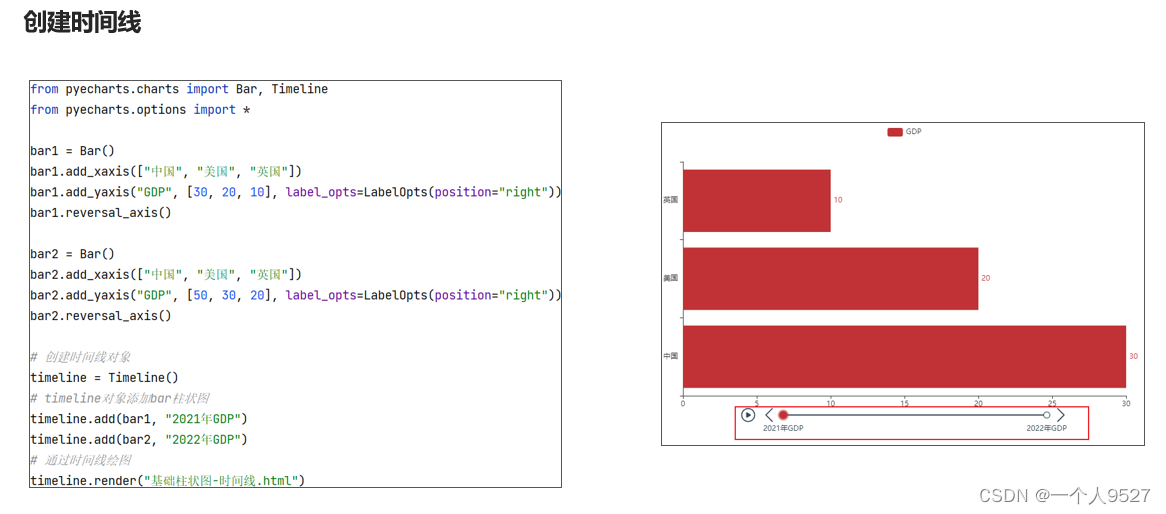
"""
演示带有时间线的柱状图开发
"""
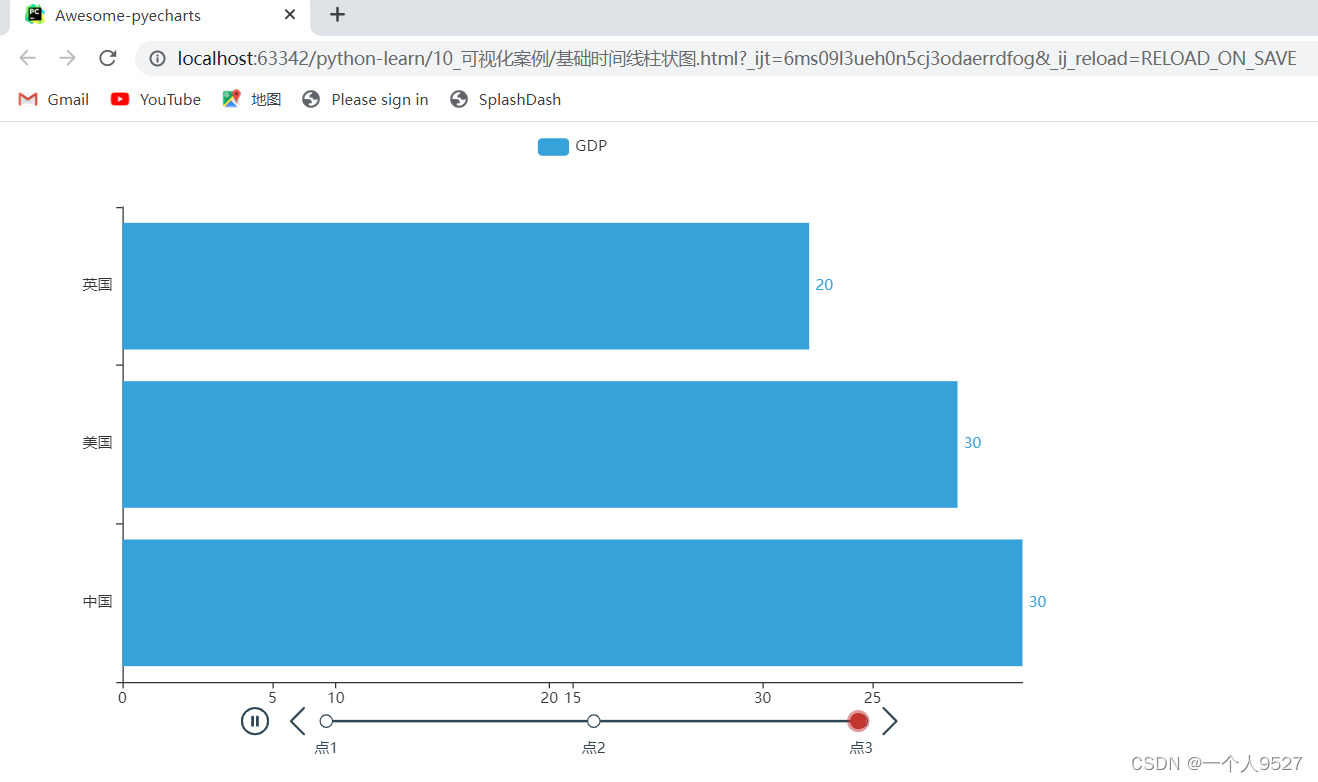
from pyecharts.charts import Bar, Timeline
from pyecharts.options import LabelOpts
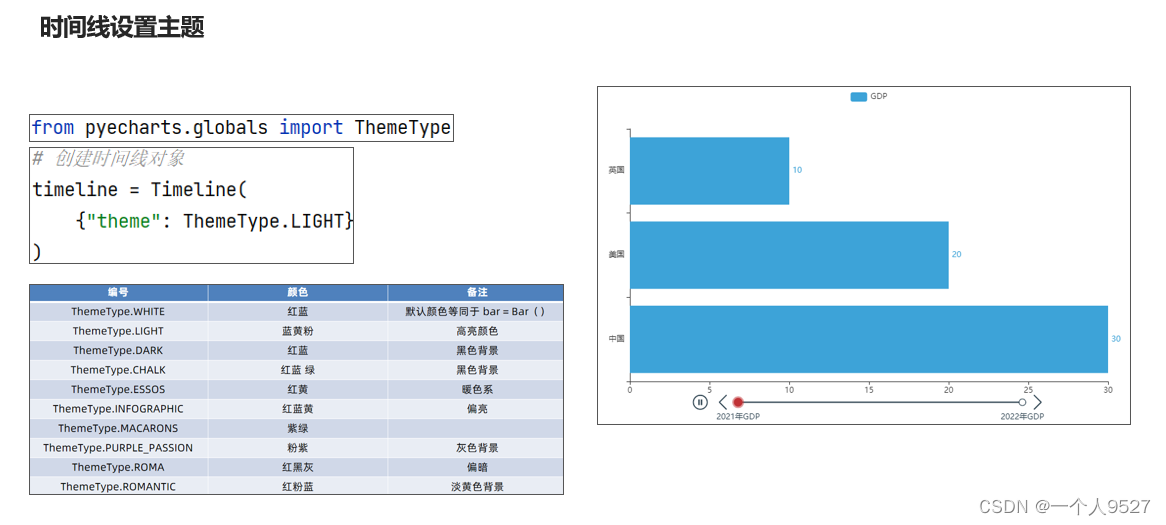
from pyecharts.globals import ThemeType

bar1 = Bar()
bar1.add_xaxis(["中国", "美国", "英国"])
bar1.add_yaxis("GDP", [30, 30, 20], label_opts=LabelOpts(position="right"))
bar1.reversal_axis()

bar2 = Bar()
bar2.add_xaxis(["中国", "美国", "英国"])
bar2.add_yaxis("GDP", [50, 50, 50], label_opts=LabelOpts(position="right"))
bar2.reversal_axis()

bar3 = Bar()
bar3.add_xaxis(["中国", "美国", "英国"])
bar3.add_yaxis("GDP", [70, 60, 60], label_opts=LabelOpts(position="right"))
bar3.reversal_axis()

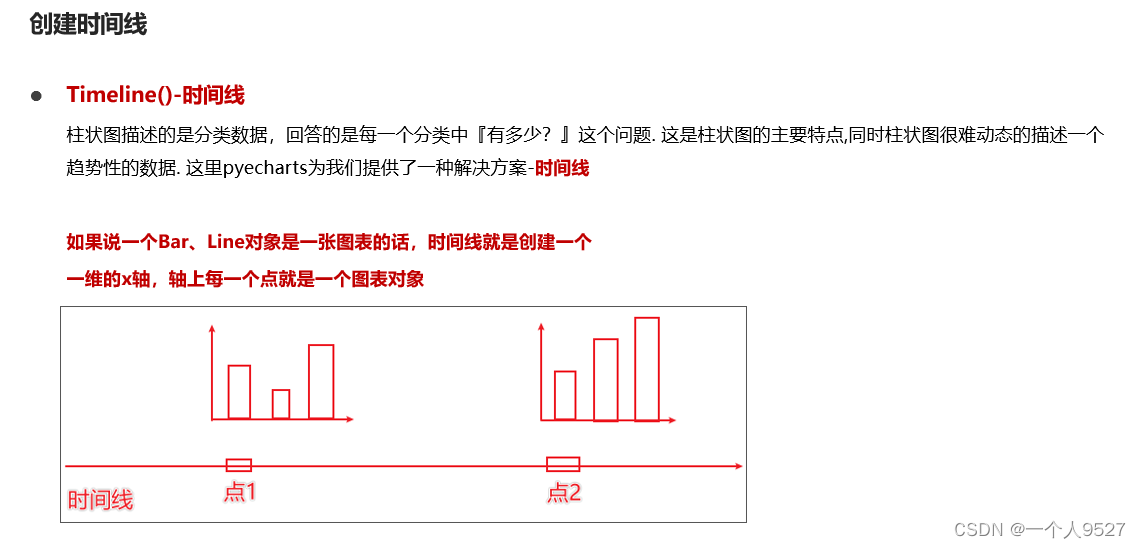
# 构建时间线对象
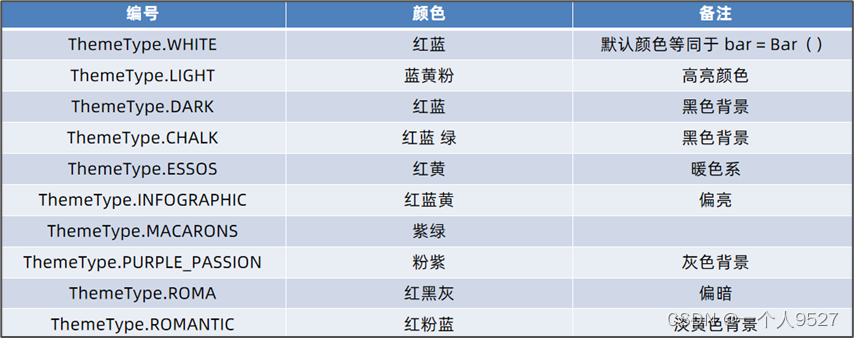
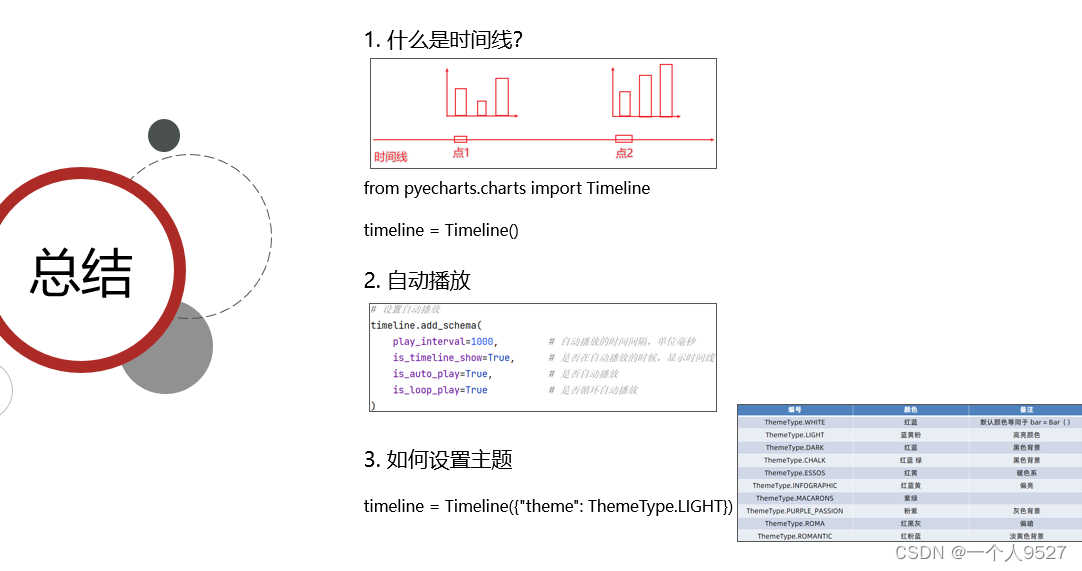
timeline = Timeline({"theme": ThemeType.LIGHT})
# 在时间线内添加柱状图对象
timeline.add(bar1, "点1")
timeline.add(bar2, "点2")
timeline.add(bar3, "点3")

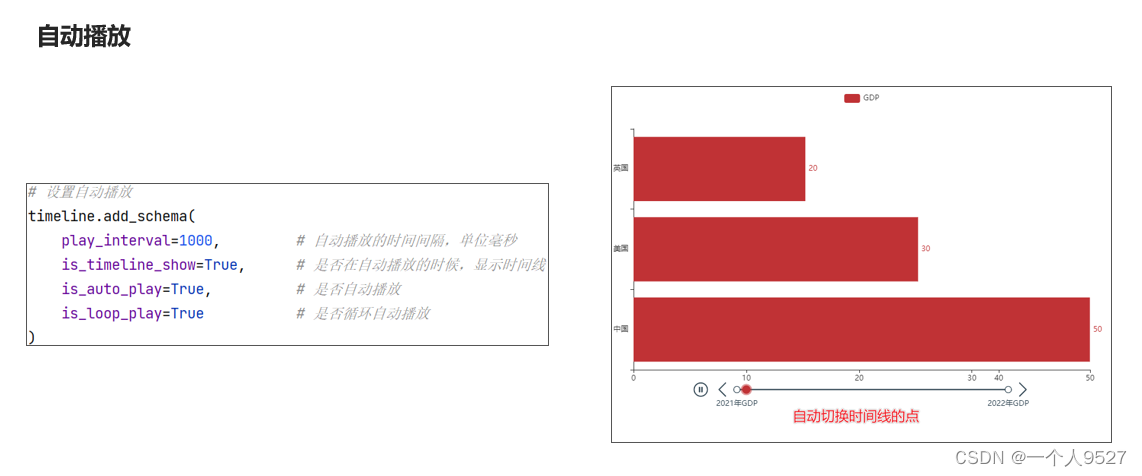
# 自动播放设置
timeline.add_schema(
    play_interval=1000,
    is_timeline_show=True,
    is_auto_play=True,
    is_loop_play=True
)

# 绘图是用时间线对象绘图,而不是bar对象了
timeline.render("基础时间线柱状图.html")
GDP动态柱状图绘制
第一阶段-第十二章-03-动态GDP柱状图绘制_哔哩哔哩_bilibili
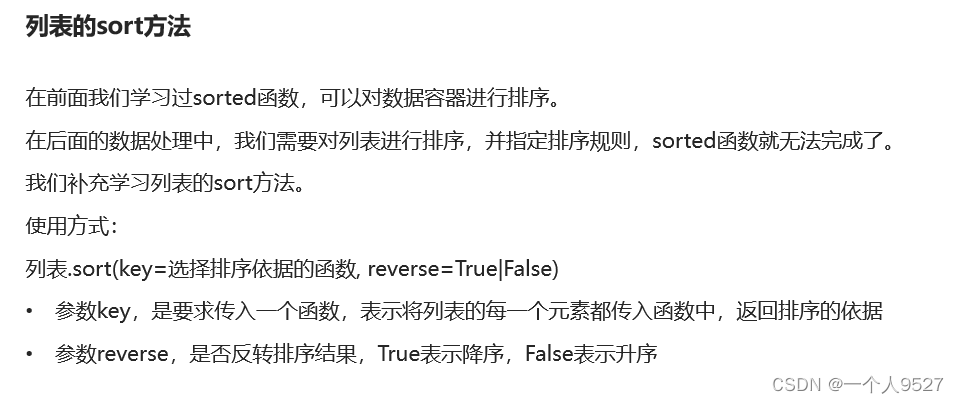
列表的sort方法并配合lambda匿名函数完成列表排序
"""
扩展列表的sort方法
在学习了将函数作为参数传递后,我们可以学习列表的sort方法来对列表进行自定义排序
"""

# 准备列表
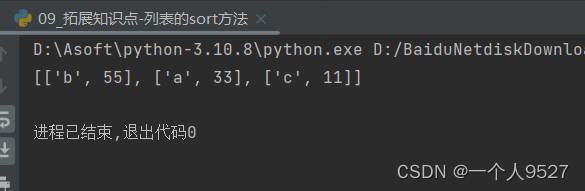
my_list = [["a", 33], ["b", 55], ["c", 11]]

# 排序,基于带名函数
# def choose_sort_key(element):
#     return element[1]
#
# my_list.sort(key=choose_sort_key, reverse=True)
# 排序,基于lambda匿名函数
my_list.sort(key=lambda element: element[1], reverse=True)

print(my_list)
图表所需的数据处理
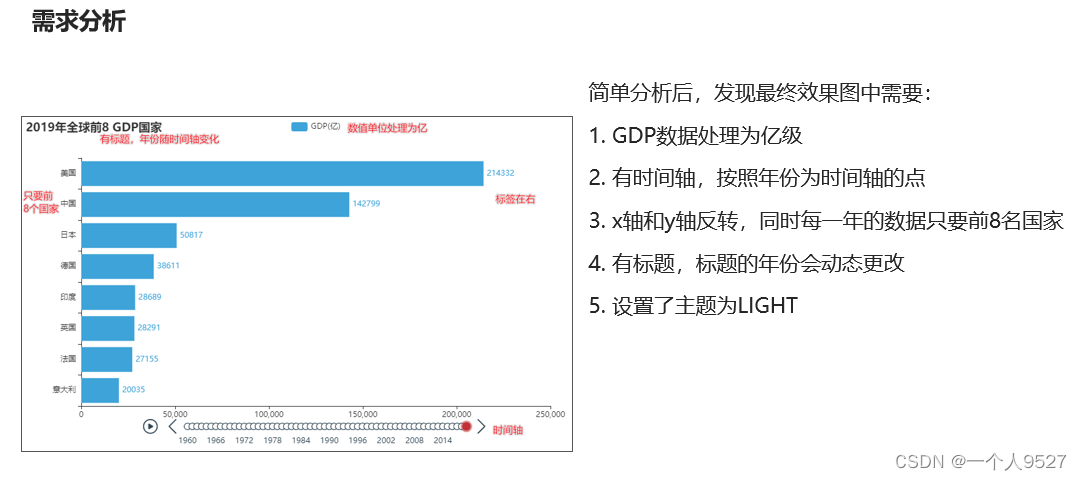
GDP动态图表绘制
"""
演示第三个图表:GDP动态柱状图开发
"""
from pyecharts.charts import Bar, Timeline
from pyecharts.options import *
from pyecharts.globals import ThemeType

# 读取数据
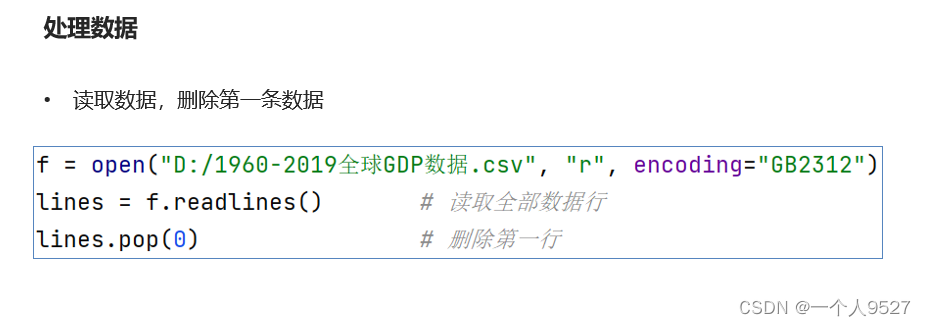
f = open("D:/1960-2019全球GDP数据.csv", "r", encoding="GB2312")
data_lines = f.readlines()
# 关闭文件
f.close()
# 删除第一条数据
data_lines.pop(0)
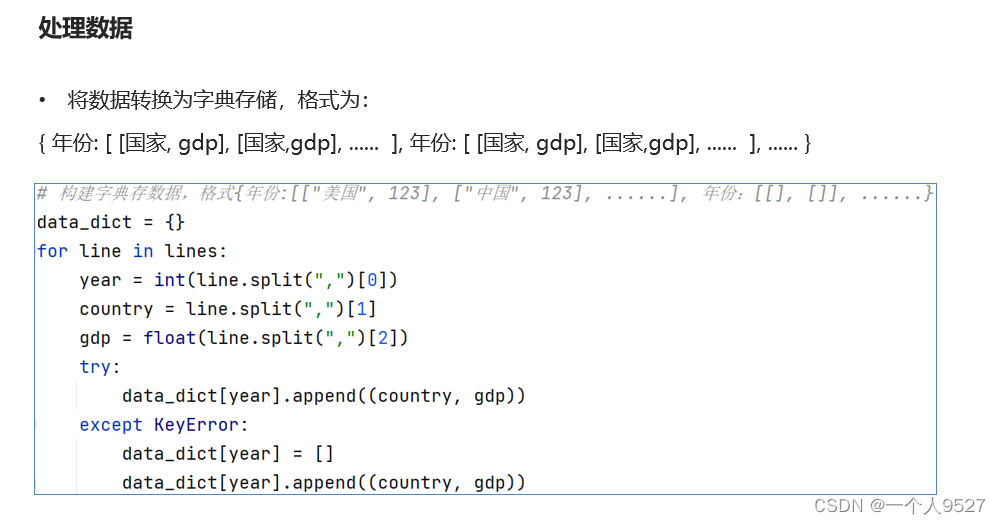
# 将数据转换为字典存储,格式为:
# { 年份: [ [国家, gdp], [国家,gdp], ......  ], 年份: [ [国家, gdp], [国家,gdp], ......  ], ...... }
# { 1960: [ [美国, 123], [中国,321], ......  ], 1961: [ [美国, 123], [中国,321], ......  ], ...... }
# 先定义一个字典对象
data_dict = {}
for line in data_lines:
    year = int(line.split(",")[0])      # 年份
    country = line.split(",")[1]        # 国家
    gdp = float(line.split(",")[2])     # gdp数据
    # 如何判断字典里面有没有指定的key呢?
    try:
        data_dict[year].append([country, gdp])
    except KeyError:
        data_dict[year] = []
        data_dict[year].append([country, gdp])

# print(data_dict[1960])
# 创建时间线对象
timeline = Timeline({"theme": ThemeType.LIGHT})
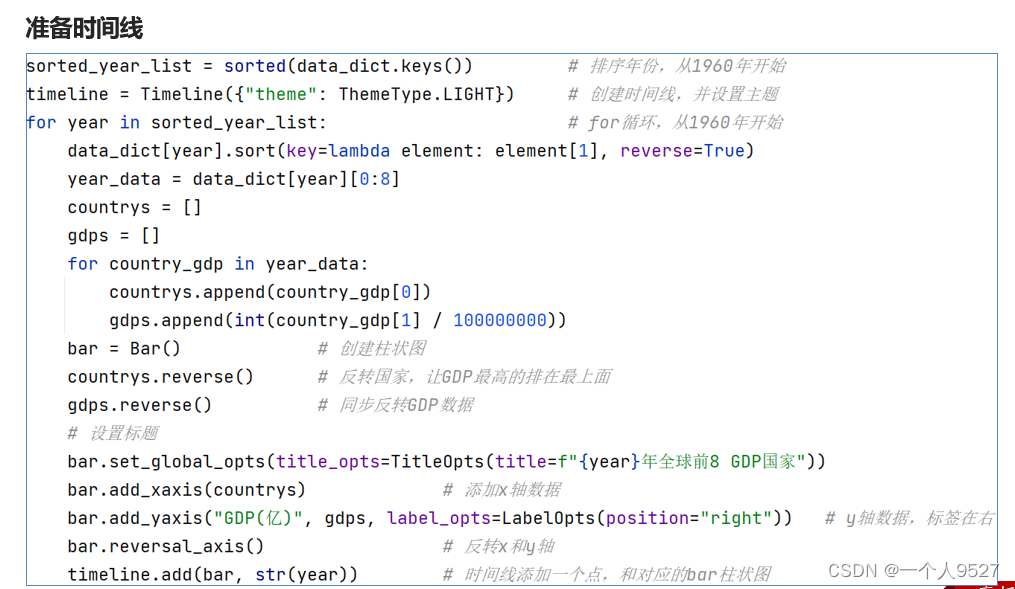
# 排序年份
sorted_year_list = sorted(data_dict.keys())
for year in sorted_year_list:
    data_dict[year].sort(key=lambda element: element[1], reverse=True)
    # 取出本年份前8名的国家
    year_data = data_dict[year][0:8]
    x_data = []
    y_data = []
    for country_gdp in year_data:
        x_data.append(country_gdp[0])   # x轴添加国家
        y_data.append(country_gdp[1] / 100000000)   # y轴添加gdp数据

    # 构建柱状图
    bar = Bar()
    x_data.reverse()
    y_data.reverse()
    bar.add_xaxis(x_data)
    bar.add_yaxis("GDP(亿)", y_data, label_opts=LabelOpts(position="right"))
    # 反转x轴和y轴
    bar.reversal_axis()
    # 设置每一年的图表的标题
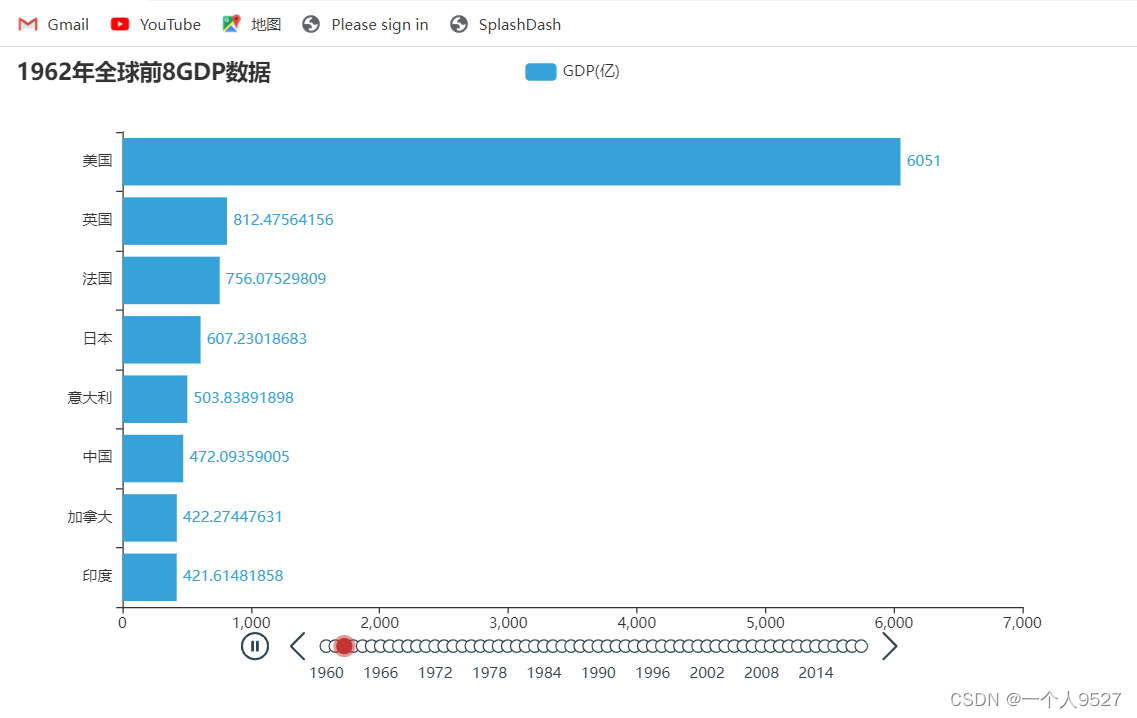
    bar.set_global_opts(
        title_opts=TitleOpts(title=f"{year}年全球前8GDP数据")
    )
    timeline.add(bar, str(year))


# for循环每一年的数据,基于每一年的数据,创建每一年的bar对象
# 在for中,将每一年的bar对象添加到时间线中

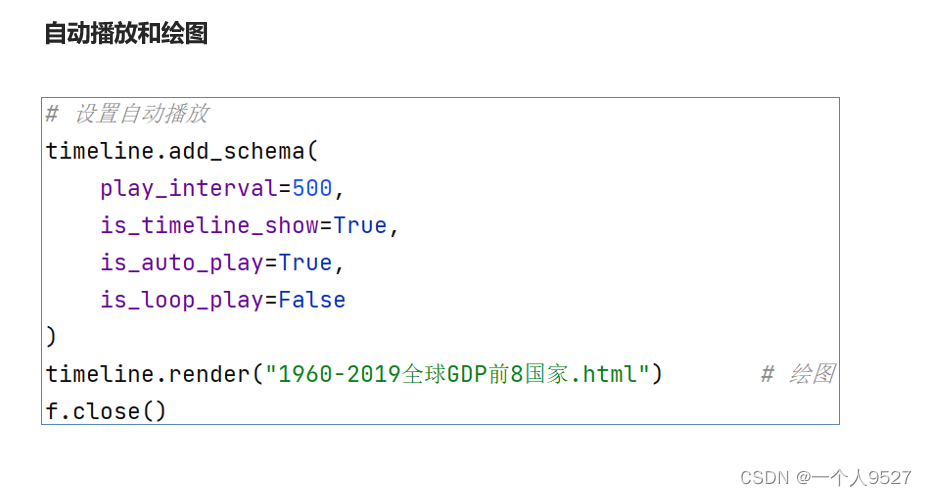
# 设置时间线自动播放
timeline.add_schema(
    play_interval=1000,
    is_timeline_show=True,
    is_auto_play=True,
    is_loop_play=False
)
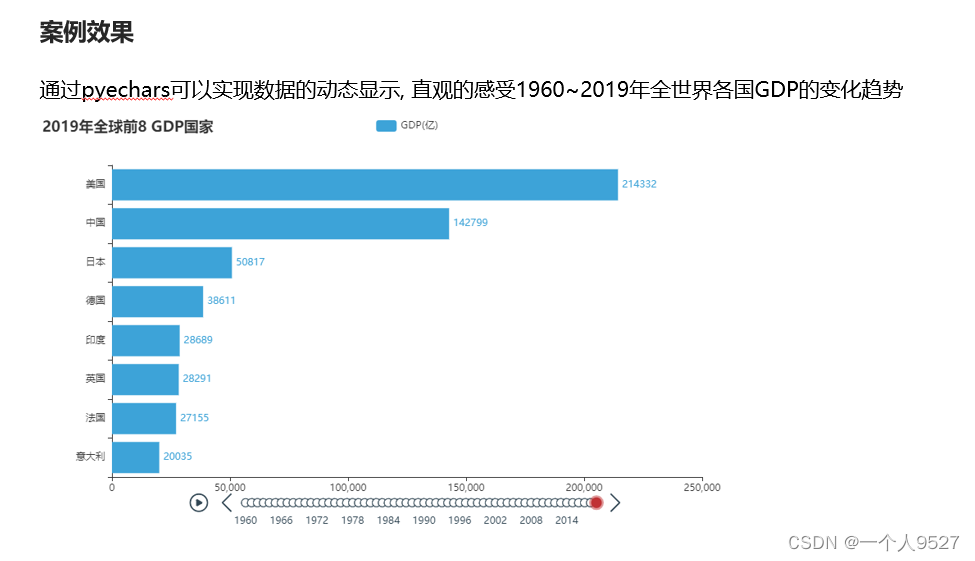
# 绘图
timeline.render("1960-2019全球GDP前8国家.html")



更多推荐



 0
0 0
0- 0


 已为社区贡献1条内容

所有评论(0)