
基于Python的性能测试工具Locust
基于Python的性能测试工具Locust
目录
一、Locust介绍
Locust(蝗虫)是一个开源的、分布式的进行负载测试的性能测试工具。Locust 的设计理念是通过代码来定义用户行为,使得用户可以很容易地编写测试脚本,模拟用户在应用程序上执行的行为,进而模拟大量并发用户进行工作。
1、特点
1)基于Python编程语言实现,能够模拟大量用户并进行性能测试,是一个用于 HTTP 和其他协议的开源性能/负载测试工具。
- HTTP/HTTPS 协议的请求基于requests库,也支持性能更好的FastHttpUser,它是使用geventhttpclient库(C语言编写的快速http客户端,为高并发、流式传输并支持 HTTP 1.1 持久连接而设计)来实现的
- Locust 也可以测试其它协议的系统,只需要采用Python调用对应的库进行请求描述即可。
2)Locust具有强大的扩展性,支持使用常规Python库进行扩展,非常灵活,可以像编写普通的Python代码一样编写测试场景,而无需使用回调或其他复杂的机制。
3)不同于并发机制为线程的Jmeter,Locust的并发机制采用协程(gevent)的机制。它是基于事件的,单个进程可以处理数千个并发用户。每个 Locust 用户的低开销使其非常适合测试高度并发的工作负载
4)Locust支持分布式压测,运行分布在多台机器上的负载测试非常方便,使用多台机器模拟超高并发下的压测场景
5)Locust 具有用户友好的 Web 界面,可以实时监控测试进度。可以轻松查看吞吐量、响应时间和错误,并在测试运行时动态更改负载。还能生成详细的实时报告。同时没有 UI 的情况下支持命令方式运行,从而易于用于 CI/CD 测试

2、核心概念
1)分布式
- Master节点:负责协调和管理整个测试过程,包括启动和停止测试、分发任务、收集和汇总测试结果等。
- Worker节点:实际执行测试任务的节点,根据Master节点分配的任务进行模拟用户行为。
2)Web UI
- 提供可视化的测试界面,方便用户查看测试结果、监控测试进度等。
- Locust 提供了一个基于 Web 的用户界面,可以通过浏览器实时监控测试的执行情况。
3)测试脚本:定义模拟用户行为的逻辑和参数,由Worker节点执行。
- User(用户):在 Locust 中,模拟用户的基本单位是 User。用户可以执行任务(Task)并模拟实际用户的行为。
- Task(任务):任务是用户在测试中要执行的具体操作,如访问网页、提交表单等。
- TaskSet(任务集):TaskSet 是一组相关的任务,可以定义一个用户执行的任务集合。
二、和JMeter对比
| JMeter | Locust | |
|---|---|---|
| 语言和环境 | 使用Java编写 需要Java Runtime Environment (JRE) 支持 | 使用Python编写 需要安装Python环境 |
| 开源许可证 | 基于Apache License 2.0 | 基于MIT License |
| 用户界面 | 图形用户界面(GUI)客户端 | 基于Web的用户界面 |
| 脚本编写 | 图形用户界面或XML脚本来定义 支持通过Jython或Groovy等脚本语言编写脚本 | 使用Python编写脚本 通过定义用户行为的类和任务来模拟负载 |
| 并发机制 | 基于线程的模型,它为每个用户分配一个单独的线程。 每个步骤的线程分配和基准测试需要大量资源,所以在在一台机器上模拟的用户数量非常有限。 如果脚本很简单,JMeter允许您在一台机器上运行多达数千个,但脚本执行逐渐变得不可靠。 | 基于事件和异步方法,以协程gevent库作为整个过程的基石。 在一台机器上轻松模拟数千个并发用户,可同时运行内部有许多步骤的复杂测试。 相同配置下,资源占用小,Locust能支持的并发用户数相比Jmeter提升非常大 |
| 分布式测试 | 支持,可以通过多个JMeter实例来模拟大规模负载。 | 支持,可以通过多个Locust节点来协同工作。 |
| 灵活性和可扩展性 | 具有丰富的内置元件和插件,适用于各种场景。但有时可能相对较重。 | 相对较轻量,可以通过编写Python脚本实现定制化需求 |
| 支持的协议 | 功能强大,支持多种协议,如HTTP/HTTPS、FTP、SOAP/XML-RPC、Database JDBC、LDAP、TCP、SMTP/POP3、WebSocket等 | 主要专注于HTTP和WebSocket协议,其他协议需要通过编写Python脚本来定义,扩展性也是无限 |
| 实时监控 | 通过GUI查看实时图表和指标 可以在测试运行期间实时监控性能数据,并生成图形报告 | 提供了简单的终端输出。 使用第三方工具,可实现实现图形化报告,如Grafana和InfluxDB |
| 脚本录制 | 内置录制工具,也支持第三方工具 | 不支持录制,只能考虑第三方,理念是通过脚本定义用户行为 |
| 性能报告 | 提供丰富的性能指标,包括响应时间、吞吐量、错误率、并发用户数等。 可以生成多种格式的测试结果报告,包括图形报告(HTML格式)、CSV文件、XML文件等。这些报告包含了详细的性能指标和图表,方便分析 | 要关注请求数、失败数和响应时间等基本指标。 对于更详细的指标,可能需要使用第三方工具进行监控和分析。 供了简单的终端输出性能数据 可以通过使用第三方插件(例如StatsD、InfluxDB、Prometheus等)将数据导出到其他工具进行进一步分析 |
| 社区生态 | 社区庞大,插件丰富 | 社区相对较小,但在特定场景中备受欢迎,更适用于简单和可扩展的负载测试 |
| 选择建议 | Meter适合复杂的测试场景,支持多种协议,在性能结果分析方面提供了更全面的支持,包括图形报告、详细指标和丰富的输出格式 | 专注于简单的、基于代码的负载脚本编写,适用于分布式负载测试,更适合快速测试和基本性能分析,易于使用、分布式、可扩展、模块化 |
三、Locust的安装
直接 pip安装即可
1、安装Python环境
参考链接:
- https://c.biancheng.net/view/4161.html
- https://www.python.org/
- https://www.anaconda.com/
- https://docs.conda.io/en/latest/
2、安装locust包
pip install locust

# 验证安装
locust --version
# 输出示例:locust 2.19.1 from D:\Code\Python\locust\venv\lib\site-packages\locust (python 3.9.5)
四、Locust命令参数
1、help可用命令
打开cmd窗口,直接输入
locust --help
Usage: locust [options] [UserClass ...]

Common options:
  -h, --help            show this help message and exit
  -f <filename>, --locustfile <filename>
                        The Python file or module that contains your test,
                        e.g. 'my_test.py'. Also accepts multiple comma-
                        separated .py files or a package name/directory.
                        Defaults to 'locustfile'.
  --config <filename>   File to read additional configuration from. See https:
                        //docs.locust.io/en/stable/configuration.html#configur
                        ation-file
  -H <base url>, --host <base url>
                        Host to load test, in the following format:
                        https://www.example.com
  -u <int>, --users <int>
                        Peak number of concurrent Locust users. Primarily used
                        together with --headless or --autostart. Can be
                        changed during a test by keyboard inputs w, W (spawn
                        1, 10 users) and s, S (stop 1, 10 users)
  -r <float>, --spawn-rate <float>
                        Rate to spawn users at (users per second). Primarily
                        used together with --headless or --autostart
  -t <time string>, --run-time <time string>
                        Stop after the specified amount of time, e.g. (300s,
                        20m, 3h, 1h30m, etc.). Only used together with
                        --headless or --autostart. Defaults to run forever.
  -l, --list            Show list of possible User classes and exit

Web UI options:
  --web-host <ip>       Host to bind the web interface to. Defaults to '*'
                        (all interfaces)
  --web-port <port number>, -P <port number>
                        Port on which to run web host
  --headless            Disable the web interface, and start the test
                        immediately. Use -u and -t to control user count and
                        run time
  --autostart           Starts the test immediately (like --headless, but
                        without disabling the web UI)
  --autoquit <seconds>  Quits Locust entirely, X seconds after the run is
                        finished. Only used together with --autostart. The
                        default is to keep Locust running until you shut it
                        down using CTRL+C
  --web-auth <username:password>
                        DEPRECATED Turn on Basic Auth for the web interface.
                        Should be supplied in the following format:
                        username:password
  --tls-cert <filename>
                        Optional path to TLS certificate to use to serve over
                        HTTPS
  --tls-key <filename>  Optional path to TLS private key to use to serve over
                        HTTPS
  --class-picker        Enable select boxes in the web interface to choose
                        from all available User classes and Shape classes
  --modern-ui           Use the new React-based frontend for the web UI

Master options:
  Options for running a Locust Master node when running Locust distributed. A Master node need Worker nodes that connect to it before it can run load tests.

  --master              Launch locust as a master node, to which worker nodes
                        connect.
  --master-bind-host <ip>
                        IP address for the master to listen on, e.g
                        '192.168.1.1'. Defaults to * (all available
                        interfaces).
  --master-bind-port <port number>
                        Port for the master to listen on. Defaults to 5557.
  --expect-workers <int>
                        Delay starting the test until this number of workers
                        have connected (only used in combination with
                        --headless/--autostart).
  --expect-workers-max-wait <int>
                        How long should the master wait for workers to connect
                        before giving up. Defaults to wait forever

Worker options:
  Options for running a Locust Worker node when running Locust distributed.
  Typically ONLY these options (and --locustfile) need to be specified on workers, since other options (-u, -r, -t, ...) are controlled by the master node.

  --worker              Set locust to run in distributed mode with this
                        process as worker
  --processes <int>     Number of times to fork the locust process, to enable
                        using system. Combine with --worker flag or let it
                        automatically set --worker and --master flags for an
                        all-in-one-solution. Not available on Windows.
                        Experimental.
  --master-host <hostname>
                        Hostname of locust master node to connect to. Defaults
                        to 127.0.0.1.
  --master-port <port number>
                        Port to connect to on master node. Defaults to 5557.

Tag options:
  Locust tasks can be tagged using the @tag decorator. These options let specify which tasks to include or exclude during a test.

  -T [<tag> ...], --tags [<tag> ...]
                        List of tags to include in the test, so only tasks
                        with any matching tags will be executed
  -E [<tag> ...], --exclude-tags [<tag> ...]
                        List of tags to exclude from the test, so only tasks
                        with no matching tags will be executed

Request statistics options:
  --csv <filename>      Store request stats to files in CSV format. Setting
                        this option will generate three files:
                        <filename>_stats.csv, <filename>_stats_history.csv and
                        <filename>_failures.csv. Any folders part of the
                        prefix will be automatically created
  --csv-full-history    Store each stats entry in CSV format to
                        _stats_history.csv file. You must also specify the '--
                        csv' argument to enable this.
  --print-stats         Enable periodic printing of request stats in UI runs
  --only-summary        Disable periodic printing of request stats during
                        --headless run
  --reset-stats         Reset statistics once spawning has been completed.
                        Should be set on both master and workers when running
                        in distributed mode
  --html <filename>     Store HTML report to file path specified
  --json                Prints the final stats in JSON format to stdout.
                        Useful for parsing the results in other
                        programs/scripts. Use together with --headless and
                        --skip-log for an output only with the json data.

Logging options:
  --skip-log-setup      Disable Locust's logging setup. Instead, the
                        configuration is provided by the Locust test or Python
                        defaults.
  --loglevel <level>, -L <level>
                        Choose between DEBUG/INFO/WARNING/ERROR/CRITICAL.
                        Default is INFO.
  --logfile <filename>  Path to log file. If not set, log will go to stderr

Other options:
  --show-task-ratio     Print table of the User classes' task execution ratio.
                        Use this with non-zero --user option if some classes
                        define non-zero fixed_count attribute.
  --show-task-ratio-json
                        Print json data of the User classes' task execution
                        ratio. Use this with non-zero --user option if some
                        classes define non-zero fixed_count attribute.
  --version, -V         Show program's version number and exit
  --exit-code-on-error <int>
                        Sets the process exit code to use when a test result
                        contain any failure or error. Defaults to 1.
  -s <number>, --stop-timeout <number>
                        Number of seconds to wait for a simulated user to
                        complete any executing task before exiting. Default is
                        to terminate immediately. This parameter only needs to
                        be specified for the master process when running
                        Locust distributed.
  --equal-weights       Use equally distributed task weights, overriding the
                        weights specified in the locustfile.
  --enable-rebalancing  Allow to automatically rebalance users if new workers
                        are added or removed during a test run.

User classes:
  <UserClass1 UserClass2>
                        At the end of the command line, you can list User
                        classes to be used (available User classes can be
                        listed with --list). LOCUST_USER_CLASSES environment
                        variable can also be used to specify User classes.
                        Default is to use all available User classes

Examples:

    locust -f my_test.py -H https://www.example.com

    locust --headless -u 100 -t 20m --processes 4 MyHttpUser AnotherUser

See documentation for more details, including how to set options using a file or environment variables: https://docs.locust.io/en/stable/configuration.html
2、所有可用的配置选项
| 命令行 | 配置文件 | 描述 |
|---|---|---|
| -f, --locustfile | locustfile | 可以是一个.py文件,也可以是多个以逗号分隔的.py文件,或者是一个软件包目录。默认为’locustfile’。 |
| -H, –host | host | 要加载测试的主机,格式如下:http://10.10.10.10 |
| -u, –users | users | Locust并发用户的峰值数量。主要是与-headless或-autostart一起使用。在测试过程中可以通过键盘输入w, W (产生1, 10个用户)和s, S (停止1, 10个用户)来改变。 |
| -r, –spawn-rate | spawn-rate | 催生用户的速度(每秒用户数)。主要是与-headless或-autostart一起使用。 |
| -t, –run-time | run-time | 在指定的时间后停止,例如(300s、20m、3h、1h30m,等等)。只与-headless或-autostart一起使用。默认为永远运行。 |
| –web-host | web-host | 绑定网络接口的主机。默认为’*'(所有接口)。 |
| –web-port, -P | web-port | 运行网络主机的端口 |
| –headless | headless | 禁用网络界面,并立即开始测试。使用-u和-t来控制用户数和运行时间 |
| –autostart | autostart | 立即启动测试(就像-headless,但不会禁用网络用户界面)。 |
| –autoquit | autoquit | 完全退出Locust,在运行结束后X秒。只和-autostart一起使用。默认情况是保持Locust运行,直到你用CTRL+C关闭它。 |
| –web-auth | web-auth | 开启网络界面的基本认证。应以下列格式提供:用户名:密码 |
| –tls-cert | tls-cert | 可选的TLS证书路径,用于通过HTTPS提供服务 |
| –tls-key | tls-key | 可选的TLS私钥路径,用于通过HTTPS提供服务 |
| –class-picker | class-picker | 在网页界面上启用选择框,从所有可用的用户类和形状类中进行选择。 |
| –master | master | 设置locust以分布式模式运行,并以该进程为主。 |
| –master-bind-host | master-bind-host | locust master应该绑定的接口(hostname, ip)。只在与-master一起运行时使用。默认为*(所有可用的接口)。 |
| –master-bind-port | master-bind-port | locust master应该绑定的端口。只在运行-master时使用。默认为5557。 |
| –expect-workers | expect-workers | 在开始测试之前,Master应该期望连接多少个worker(仅当使用-headless/autostart时)。 |
| –expect-workers-max-wait | expect-workers-max-wait | 在放弃之前,主站应该等待工人连接多长时间。默认为永远等待 |
| –worker | worker | 设置locust在分布式模式下运行,并将此进程作为工作者。 |
| –master-host | master-host | 用于分布式负载测试的蝗虫主站的主机或 IP 地址。只在与-worker一起运行时使用。默认为127.0.0.1。 |
| –master-port | master-port | 连接的端口,该端口被locust master用于分布式负载测试。只在与-worker一起运行时使用。默认为5557。 |
| -T, --tags | tags | 要包括在测试中的标签列表,因此只有具有任何匹配标签的任务才会被执行。 |
| -E, --exclude-tags | exclude-tags | 要从测试中排除的标签列表,因此只有没有匹配标签的任务才会被执行。 |
| –csv | csv | 将当前的请求统计信息以CSV格式存储到文件中。设置这个选项将生成三个文件。[CSV_PREFIX]_stats.csv, [CSV_PREFIX]_stats_history.csv and [CSV_PREFIX]_failures.csv |
| –csv-full-history | csv-full-history | 将每个统计条目以CSV格式存储到_stats_history.csv文件。你还必须指定’–csv’参数来启用它。 |
| –print-stats | print-stats | 启用在用户界面运行中定期打印请求统计信息的功能 |
| –only-summary | only-summary | 在-headless运行期间禁止定期打印请求统计信息 |
| –reset-stats | reset-stats | 一旦产卵完成,就重置统计数据。当以分布式模式运行时,应该在主站和工作站都设置。 |
| –html | html | 将HTML报告存储到指定的文件路径 |
| –skip-log-setup | skip-log-setup | 禁用Locust的日志设置。相反,配置是由Locust测试或Python默认提供的。 |
| –loglevel, -L | loglevel | 在DEBUG/INFO/WARNING/ERROR/CRITICAL之间选择。默认是INFO。 |
| –logfile | logfile | 日志文件的路径。如果不设置,日志将转到stderr。 |
| –exit-code-on-error | exit-code-on-error | 当测试结果包含任何失败或错误时,设置进程退出代码。 |
| -s, --stop-timeout | stop-timeout | 在退出之前,等待模拟用户完成任何执行任务的秒数。默认是立即终止。这个参数只需要在运行Locust分布式时为主进程指定。 |
locust的脚本里,模拟负载的请求和python的requests库使用方法基本一样
3、执行locust
文件结构
├── locustfiles/
│   ├── locustfile1.py
│   ├── locustfile2.py
│   └── more_files/
│       ├── locustfile3.py
│       ├── locust.py
│       ├── _ignoreme.py
1)执行单个指定文件
locust -f 文件名
2)执行多个指定文件
locust -f locustfiles/locustfile1.py,locustfiles/locustfile2.py,locustfiles/more_files/locustfile3.py
3)执行目录下的指定文件
递归搜索该目录中的*.py文件,忽略名为locust.py或以"_"开头的文件。
locust -f locustfiles
结果:将使用 locustfile1.py, locustfile2.py & more_files/locustfile3.py
五、Locust实践
1、核心步骤
(1)定义用户User:用户类,必须继承HttpUser,模拟实际用户的行为在host上执行task
(2)定义任务Task:接口请求的普通函数,必须使用@task修饰函数
(3)定义任务集TaskSet:TaskSet 是一组相关的任务,必须继承TaskSet的类,类里面为定义的任务
1)举例
from locust import HttpUser, task, between, TaskSet

# 定义任务集
class ShieldTaskSet(TaskSet):
    # 定义任务
    @task
    def get_commit_test(params):
        print('@task(weight):修饰函数,将函数定义成任务。weight代表权重,权重越大执行次数越多,默认值是1')

    @task(3)
    def create_testcase(params):
        print("被执行的概率是get_commit_test的三倍,数量不一定是三倍")

# 定义用户类
class ShieldUser(HttpUser):
    # wait_time属性可以让user在执行一个任务之后进行延迟,单位是秒
    wait_time = between(0.5, 5)
    # 指定host地址,压测的endpoint
    host = 'https://xcloud-tst.lenovo.com'
    # list方式:随机选择执行
    tasks = [ShieldTaskSet]

    def on_start(self):
        print('前置任务,在所有任务之前调用一次')

    def on_stop(self):
        print('后置任务,当任务集停止时调用一次')
2)启动服务
终端输入locust -f 文件名称运行
locust -f 文件名

3)web访问
打开浏览器输入localhost:8089运行locust控制界面
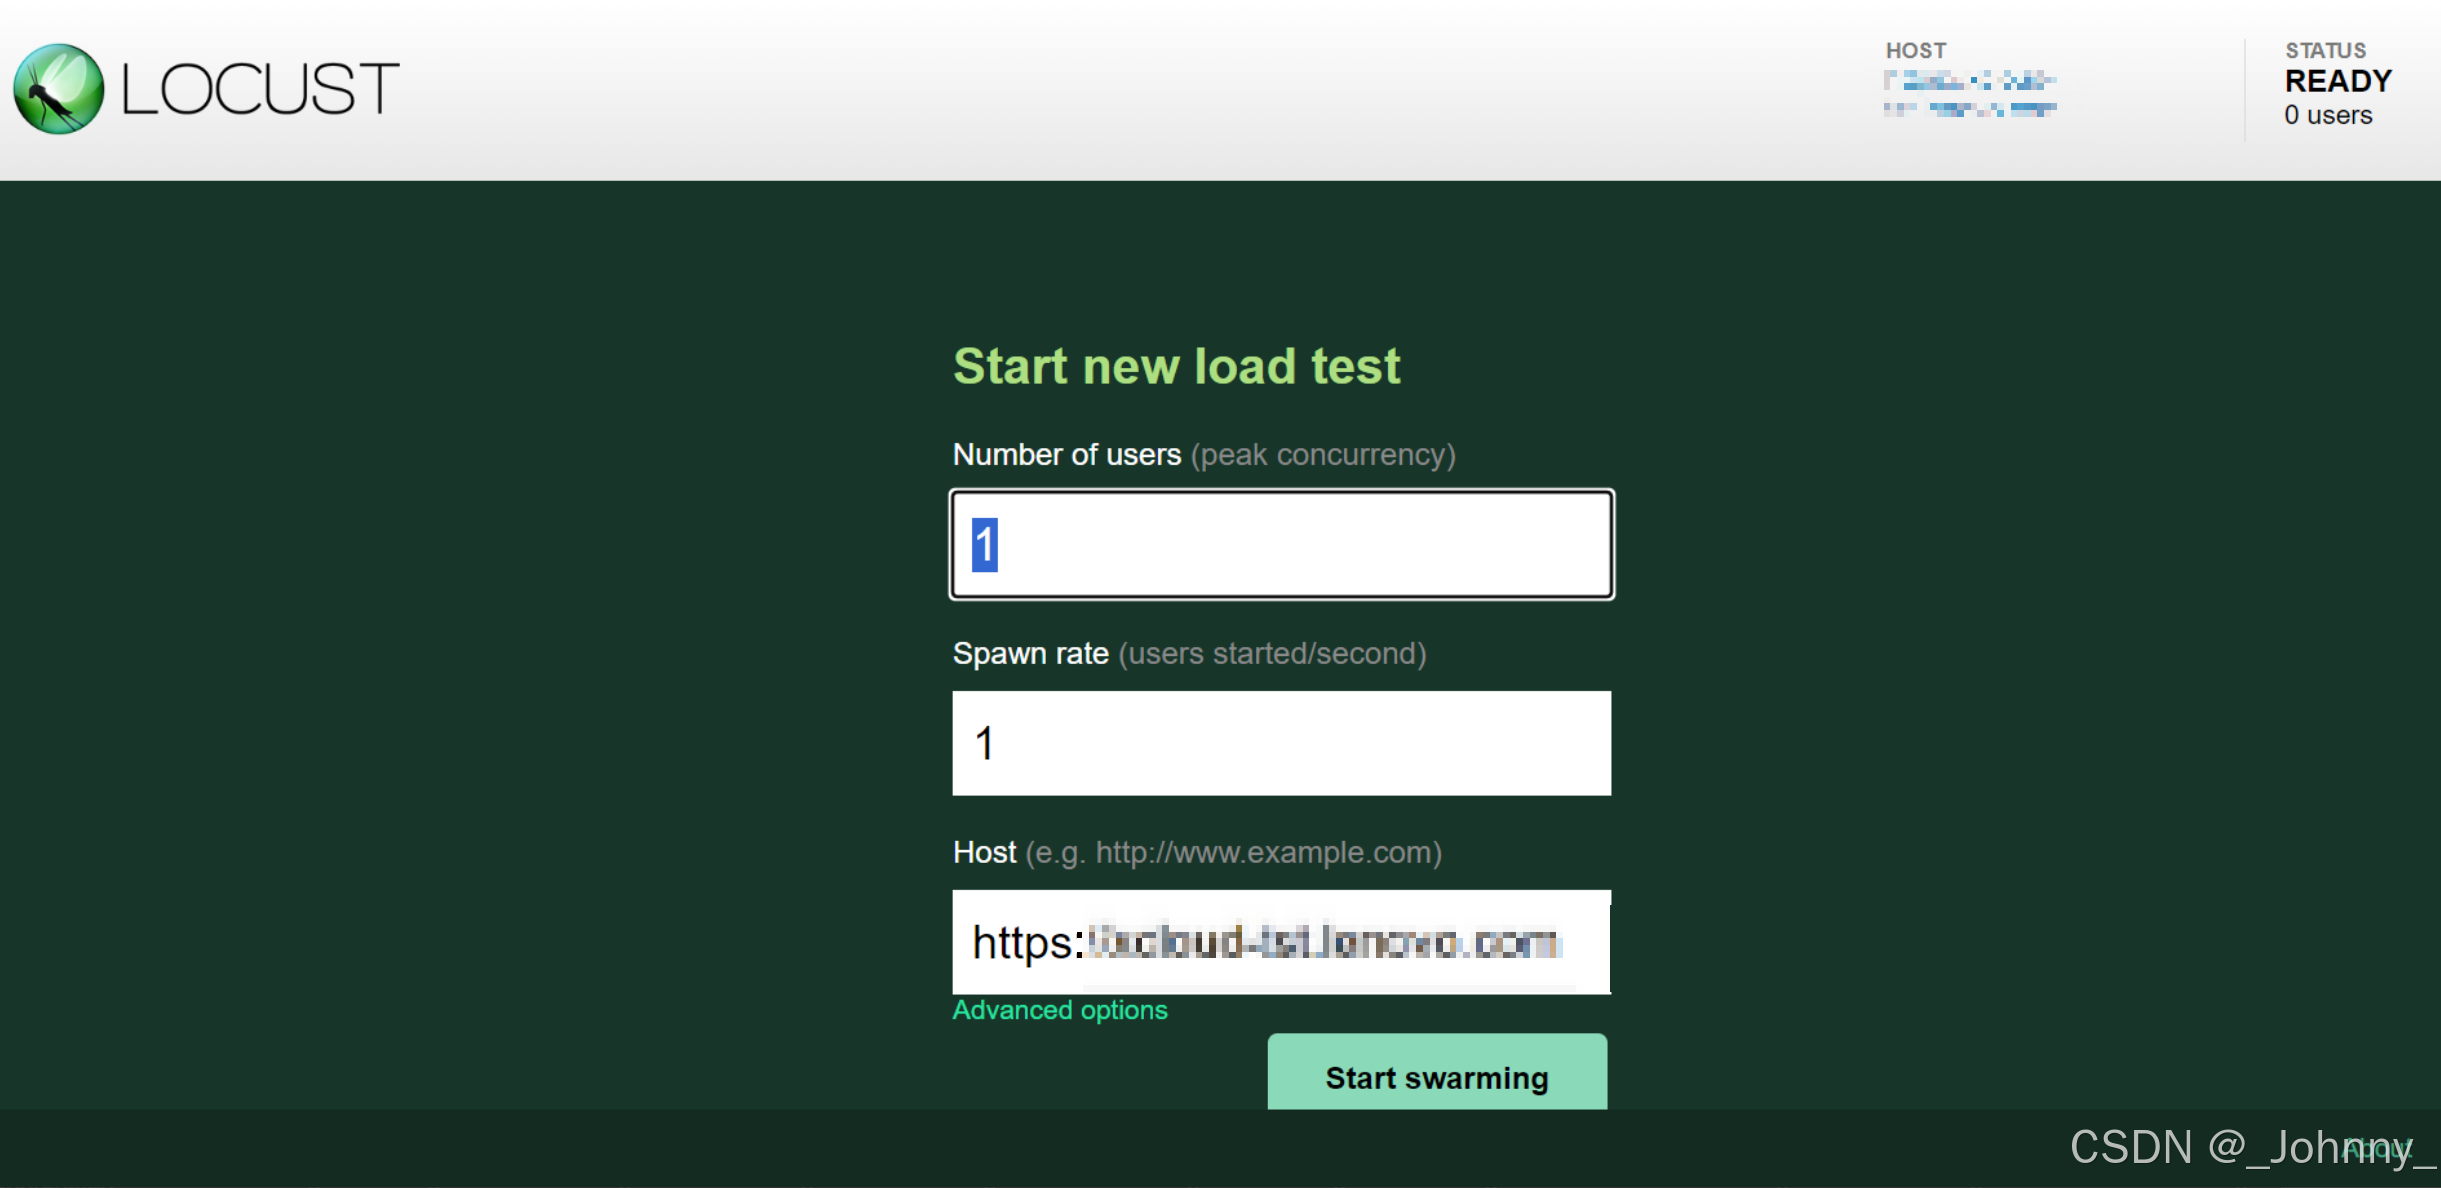
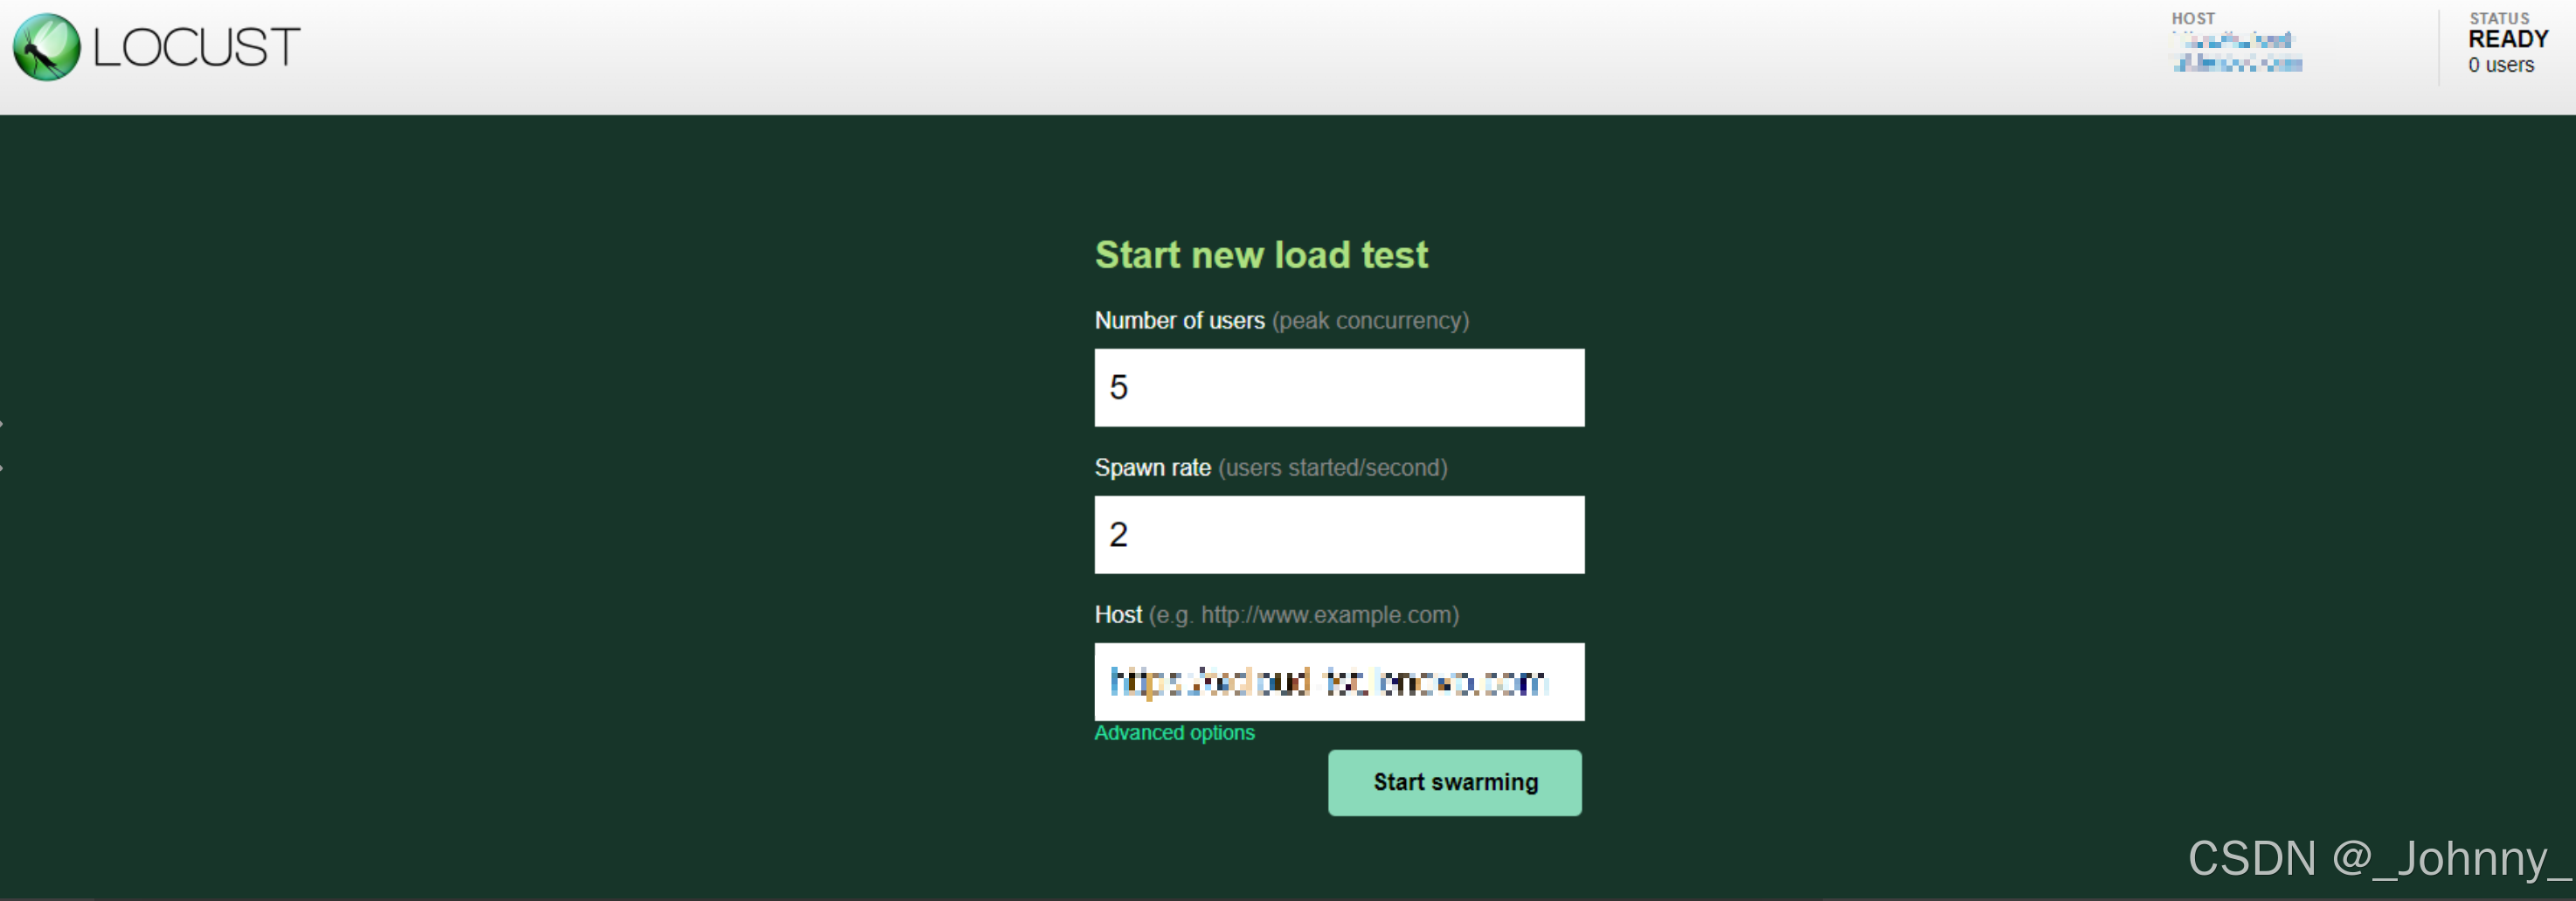
4)执行代码
- Number of users (peak concurrency):并发数量即用户数量
- Spawn rate (users started/second):每秒加载的用户数
- Host (e.g. http://www.example.com) :主机地址,代码中有Host的话可以默认执行

5)结果分析和报告下载
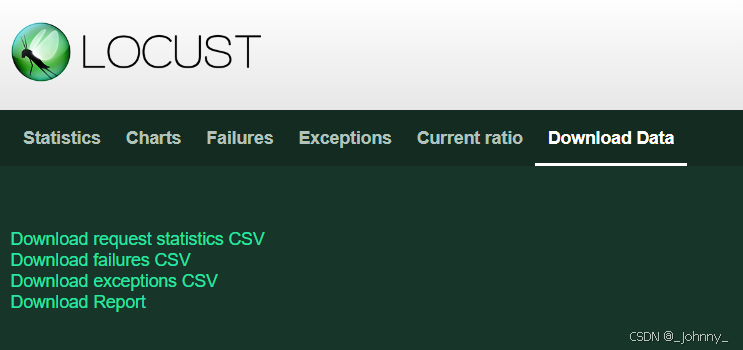
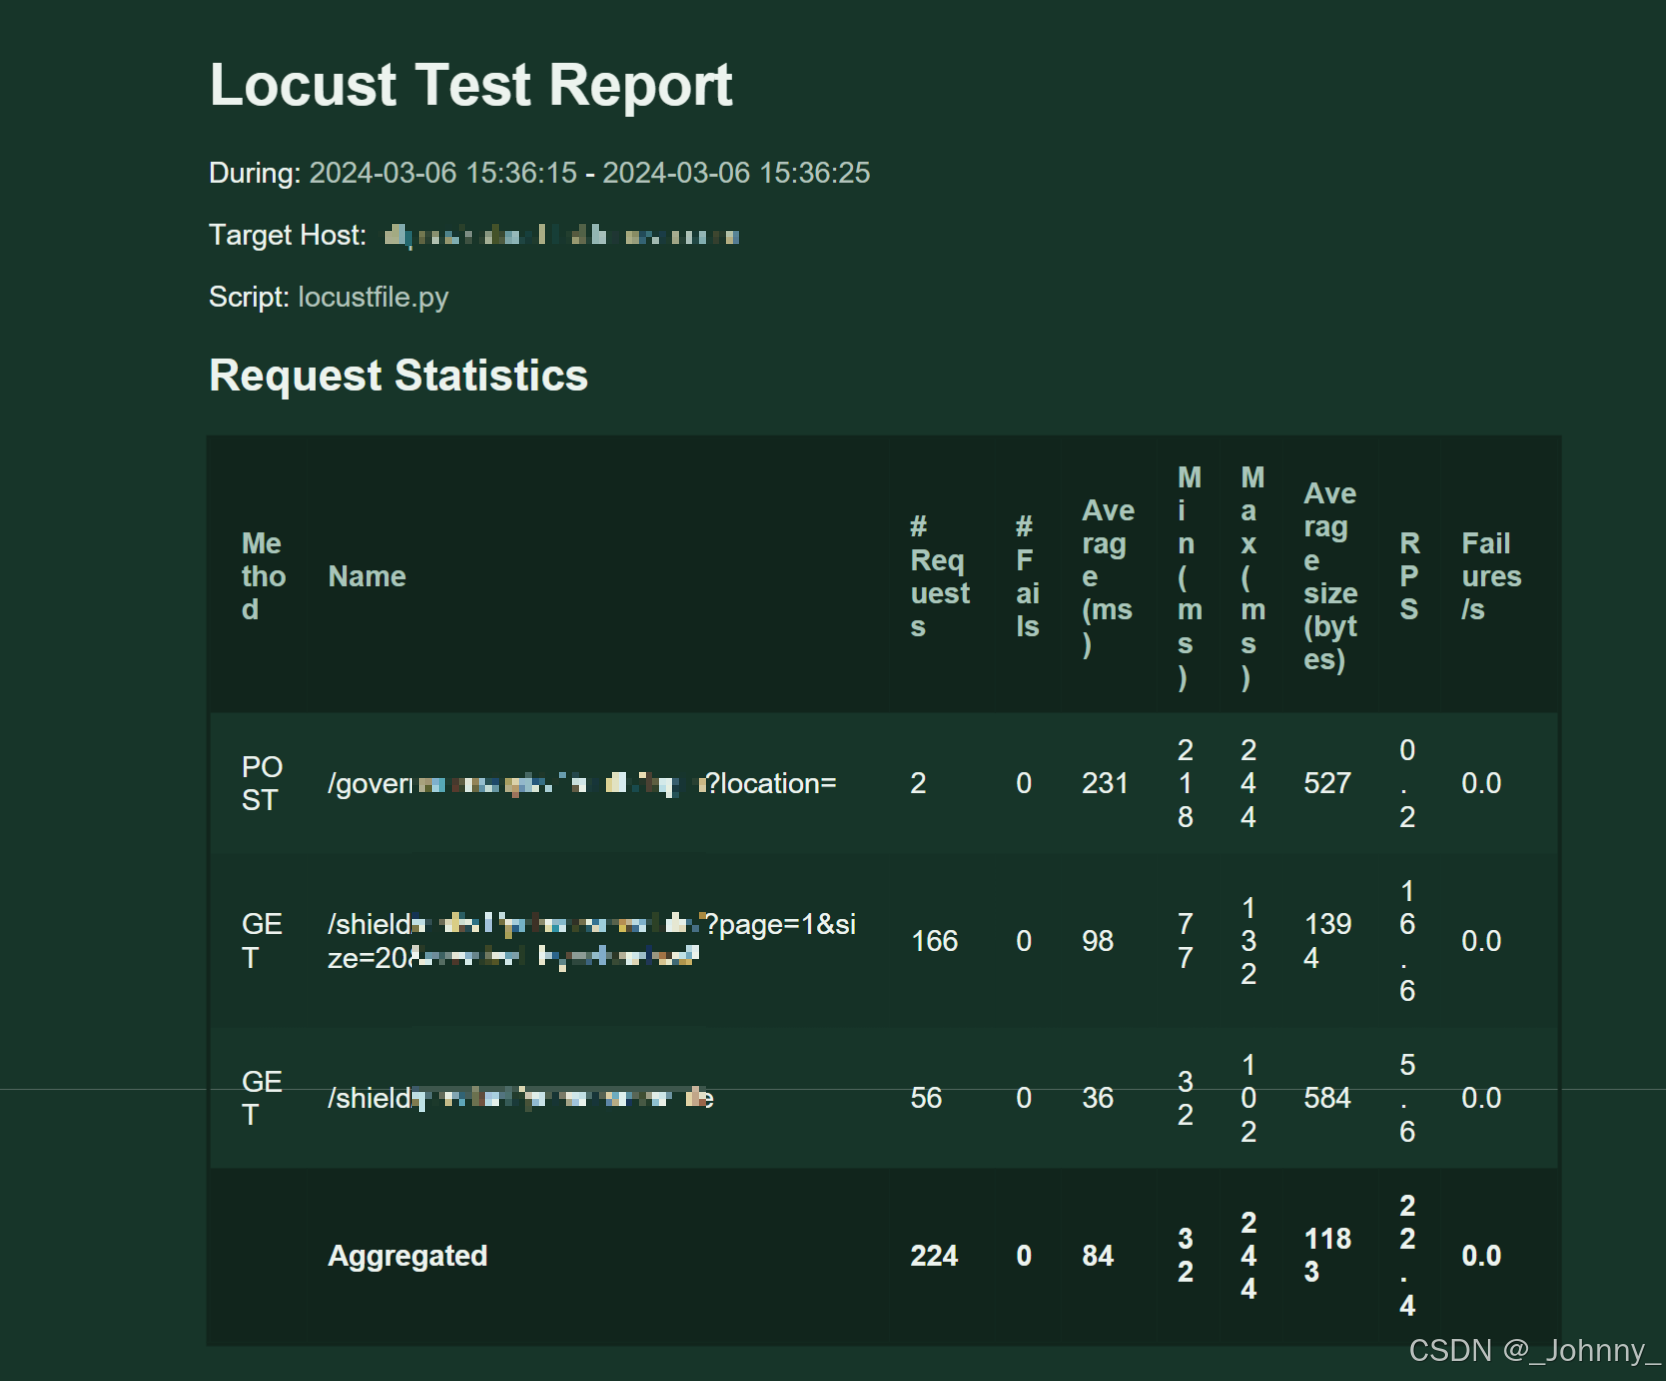
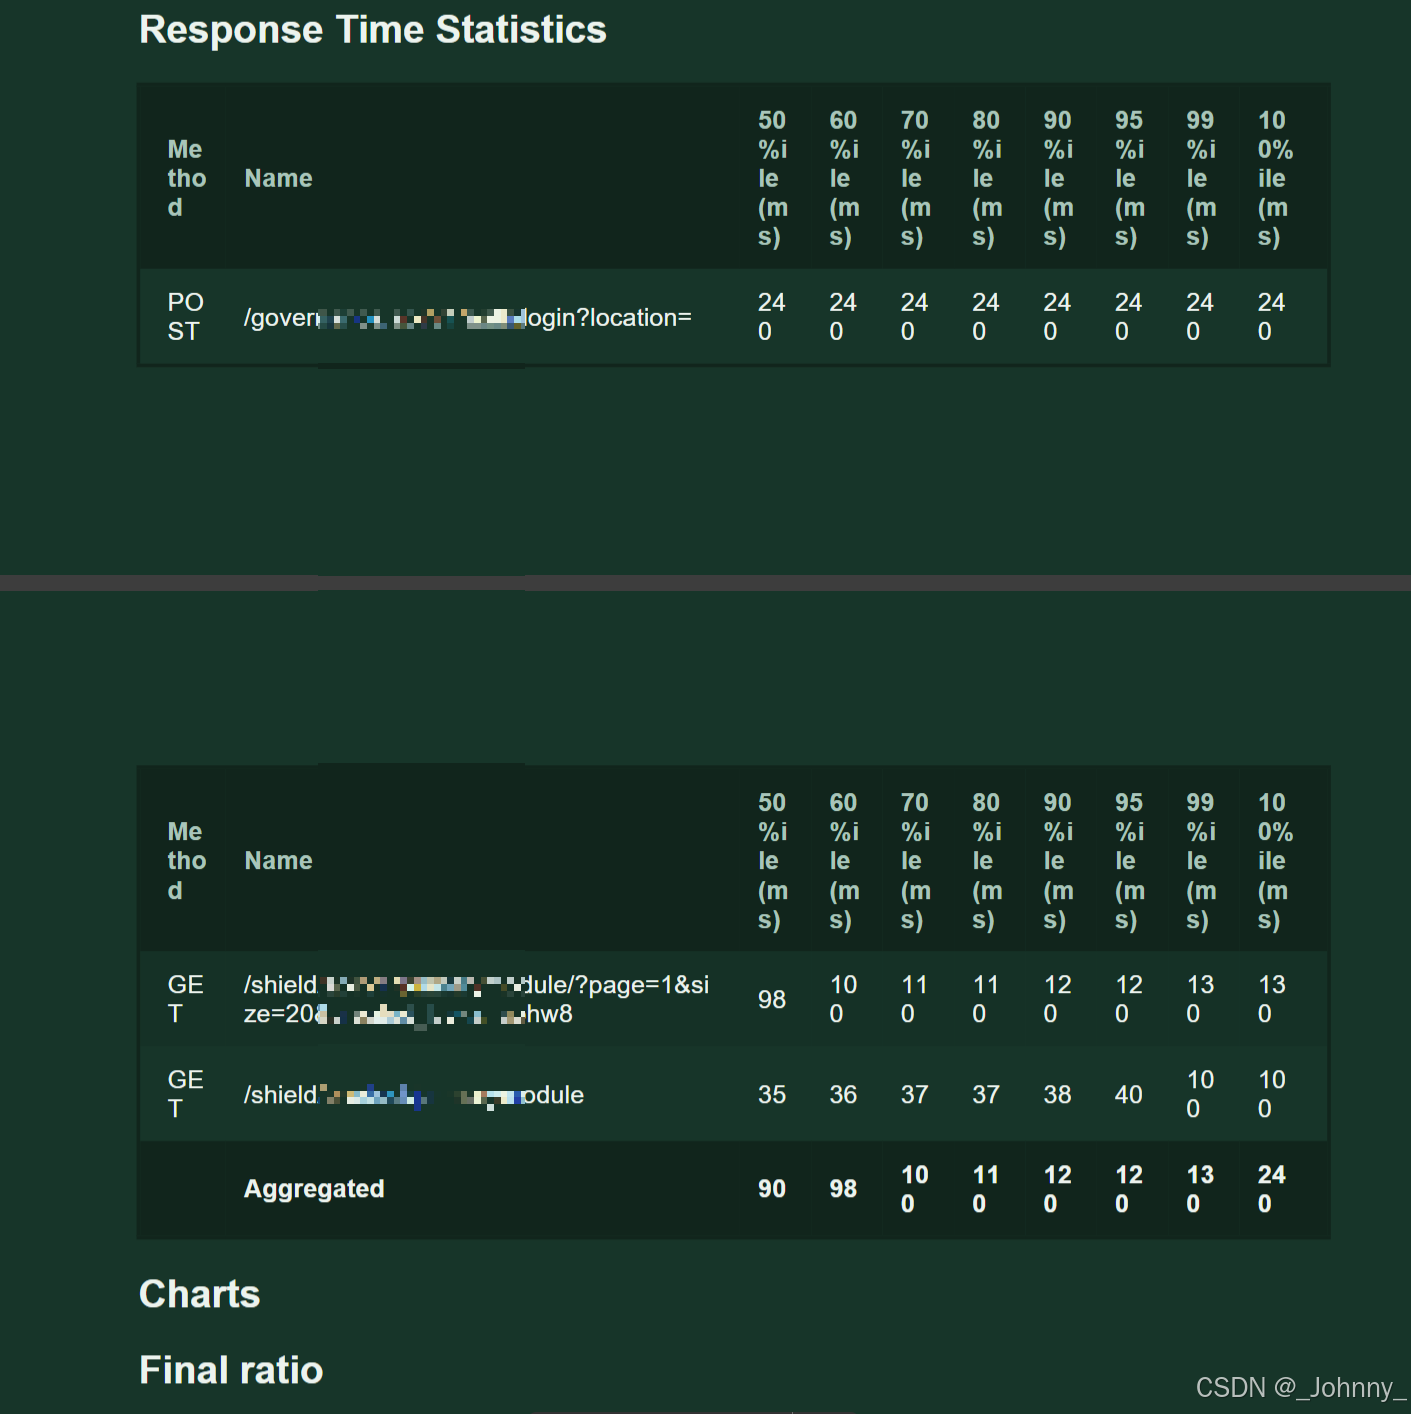
2、任务集常用的方法
(1)on_start:前置方法,在所有任务之前调用一次
(2)on_stop:后置方法,当任务集停止时调用一次
(3)@task(weight):修饰函数,将函数定义成任务。weight代表权重,权重越大执行次数越多,默认值是1
# 定义任务集
class ShieldTaskSet(TaskSet):
    # 定义任务
    @task
    def get_commit_test(params):
        print('@task(weight):修饰函数,将函数定义成任务。weight代表权重,权重越大执行次数越多,默认值是1')

    @task(3)
    def create_testcase(params):
        print("被执行的概率是get_commit_test的三倍,次数不一定是三倍")

    def on_start(self):
        print('前置任务,在所有任务之前调用一次')

    def on_stop(self):
        print('后置任务,当任务集停止时调用一次')
3、用户类常用的属性
(1)min_wait:用户执行任务之间等待时间的下界,单位:毫秒,默认值:1000
(2)max_wait:用户执行任务之间等待时间的上界,单位:毫秒,默认值:1000
(3)host:被测应用的网址,例如:http://localhost,可以在web端配置
(4)wait_time:等待时间函数,可以使用between()函数设置范围
(5)tasks:任务列表或任务字典,用于指定用户要执行的任务
(6)weight:用户权重,影响用户被选择的概率
# 定义用户类H
class ShieldUserH(HttpUser):
    # wait_time属性可以让user在执行一个任务之后进行延迟,单位是秒
    wait_time = between(0.5, 5)
    # 指定host地址,压测的endpoint
    host = 'https://xcloud-tst.lenovo.com'
    # list方式:随机选择执行
    tasks = [ShieldTaskSet]

    def on_start(self):
        print('前置任务,在所有任务之前调用一次')

    def on_stop(self):
        print('后置任务,当任务集停止时调用一次')


# 定义用户类W
class ShieldUserW(HttpUser):
    # 执行任务之间的最小等待时间
    min_wait = 100
    # 执行任务之间的最大等待时间
    max_wait = 5000
    # dict方式:根据概进行随机执行
    tasks = {ShieldPrimaryModuleTasks:2,ShieldProductTasks:1}
    weight = 10
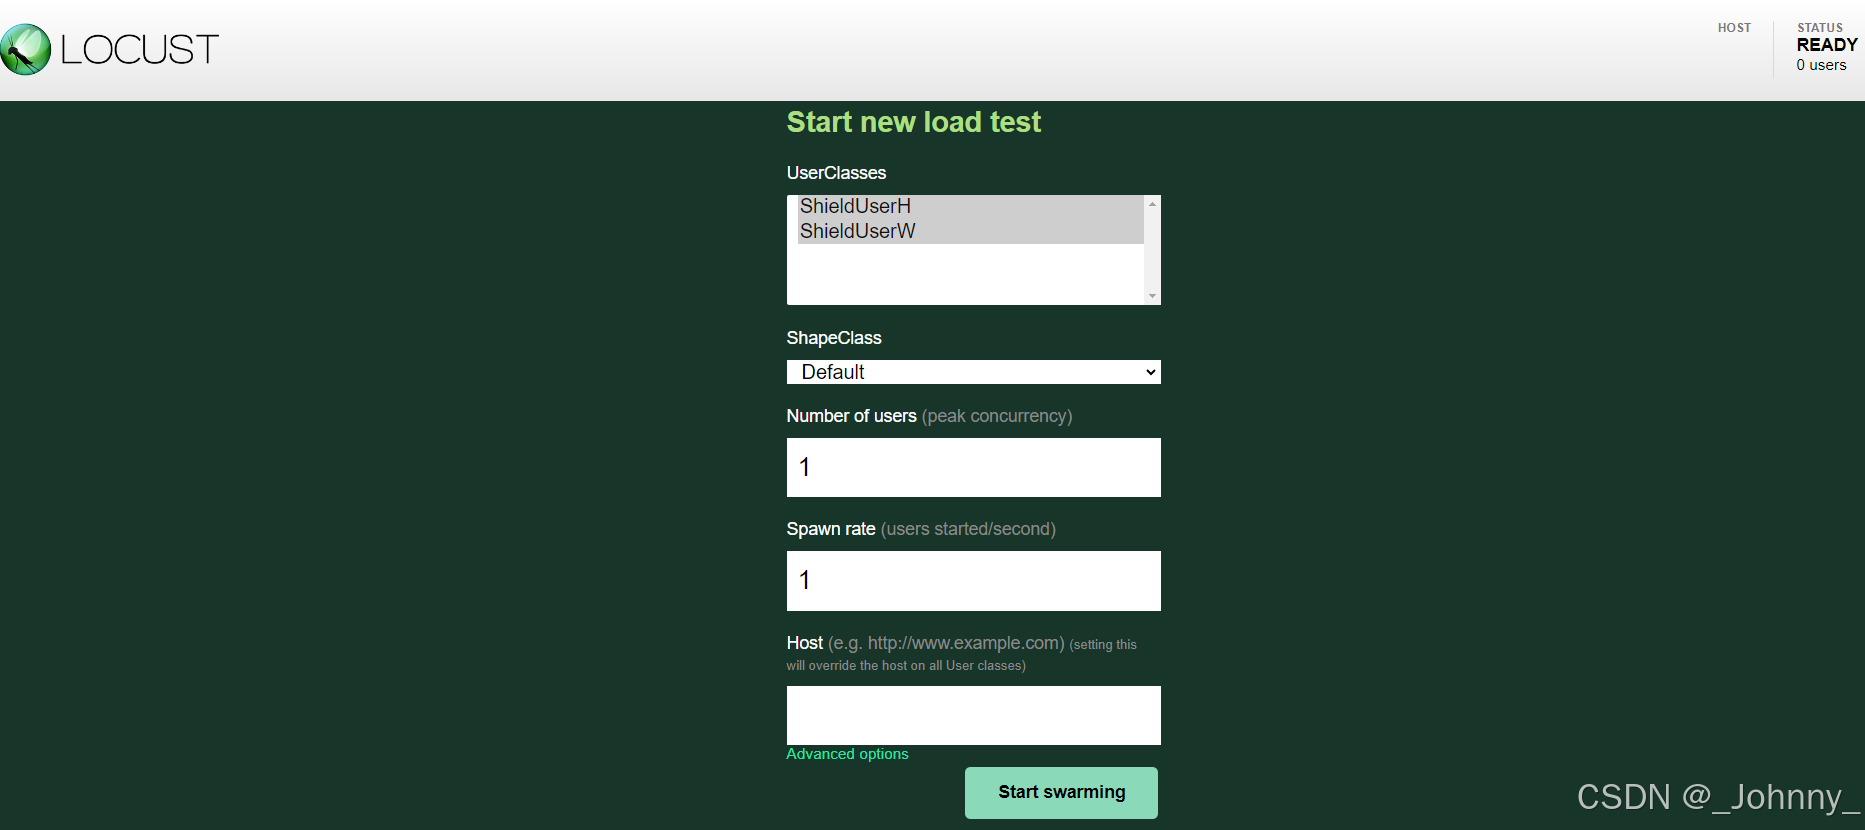
使用用户类UI选取器运行Locust,可以选择用户
locust -f 文件名 --class-picker

--class-picker 参数:可以选择运行带有标志的 locust 时在 WebUI 中运行哪个 Shape 类和哪个 User 类。没有选择使用所有可用的用户类。
4、locust分布式应用
1)基于web界面实现
(1)Master节点启动(控制机):
locust -f locustfile.py --master --web-host=0.0.0.0 --web-port=8089

locust -f 文件名 --master

(2)Worker节点启动(执行机):
locust -f locustfile.py --worker --master-host=<master-ip>

locust -f 文件名 --worker --master-host=主机ip地址 --master-port=主机端口
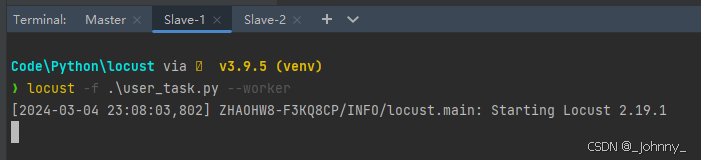
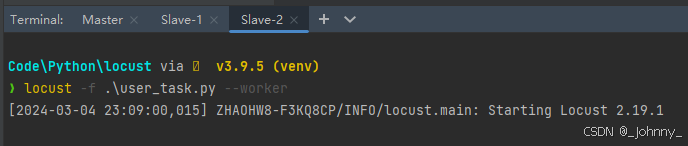
从属主机注意
- 必须有python及locust环境
- 必须有主机脚本的副本
- 如果从属主机与主机在同一台机器上,–master-host和–master-port可以不写
(3)主从关联:
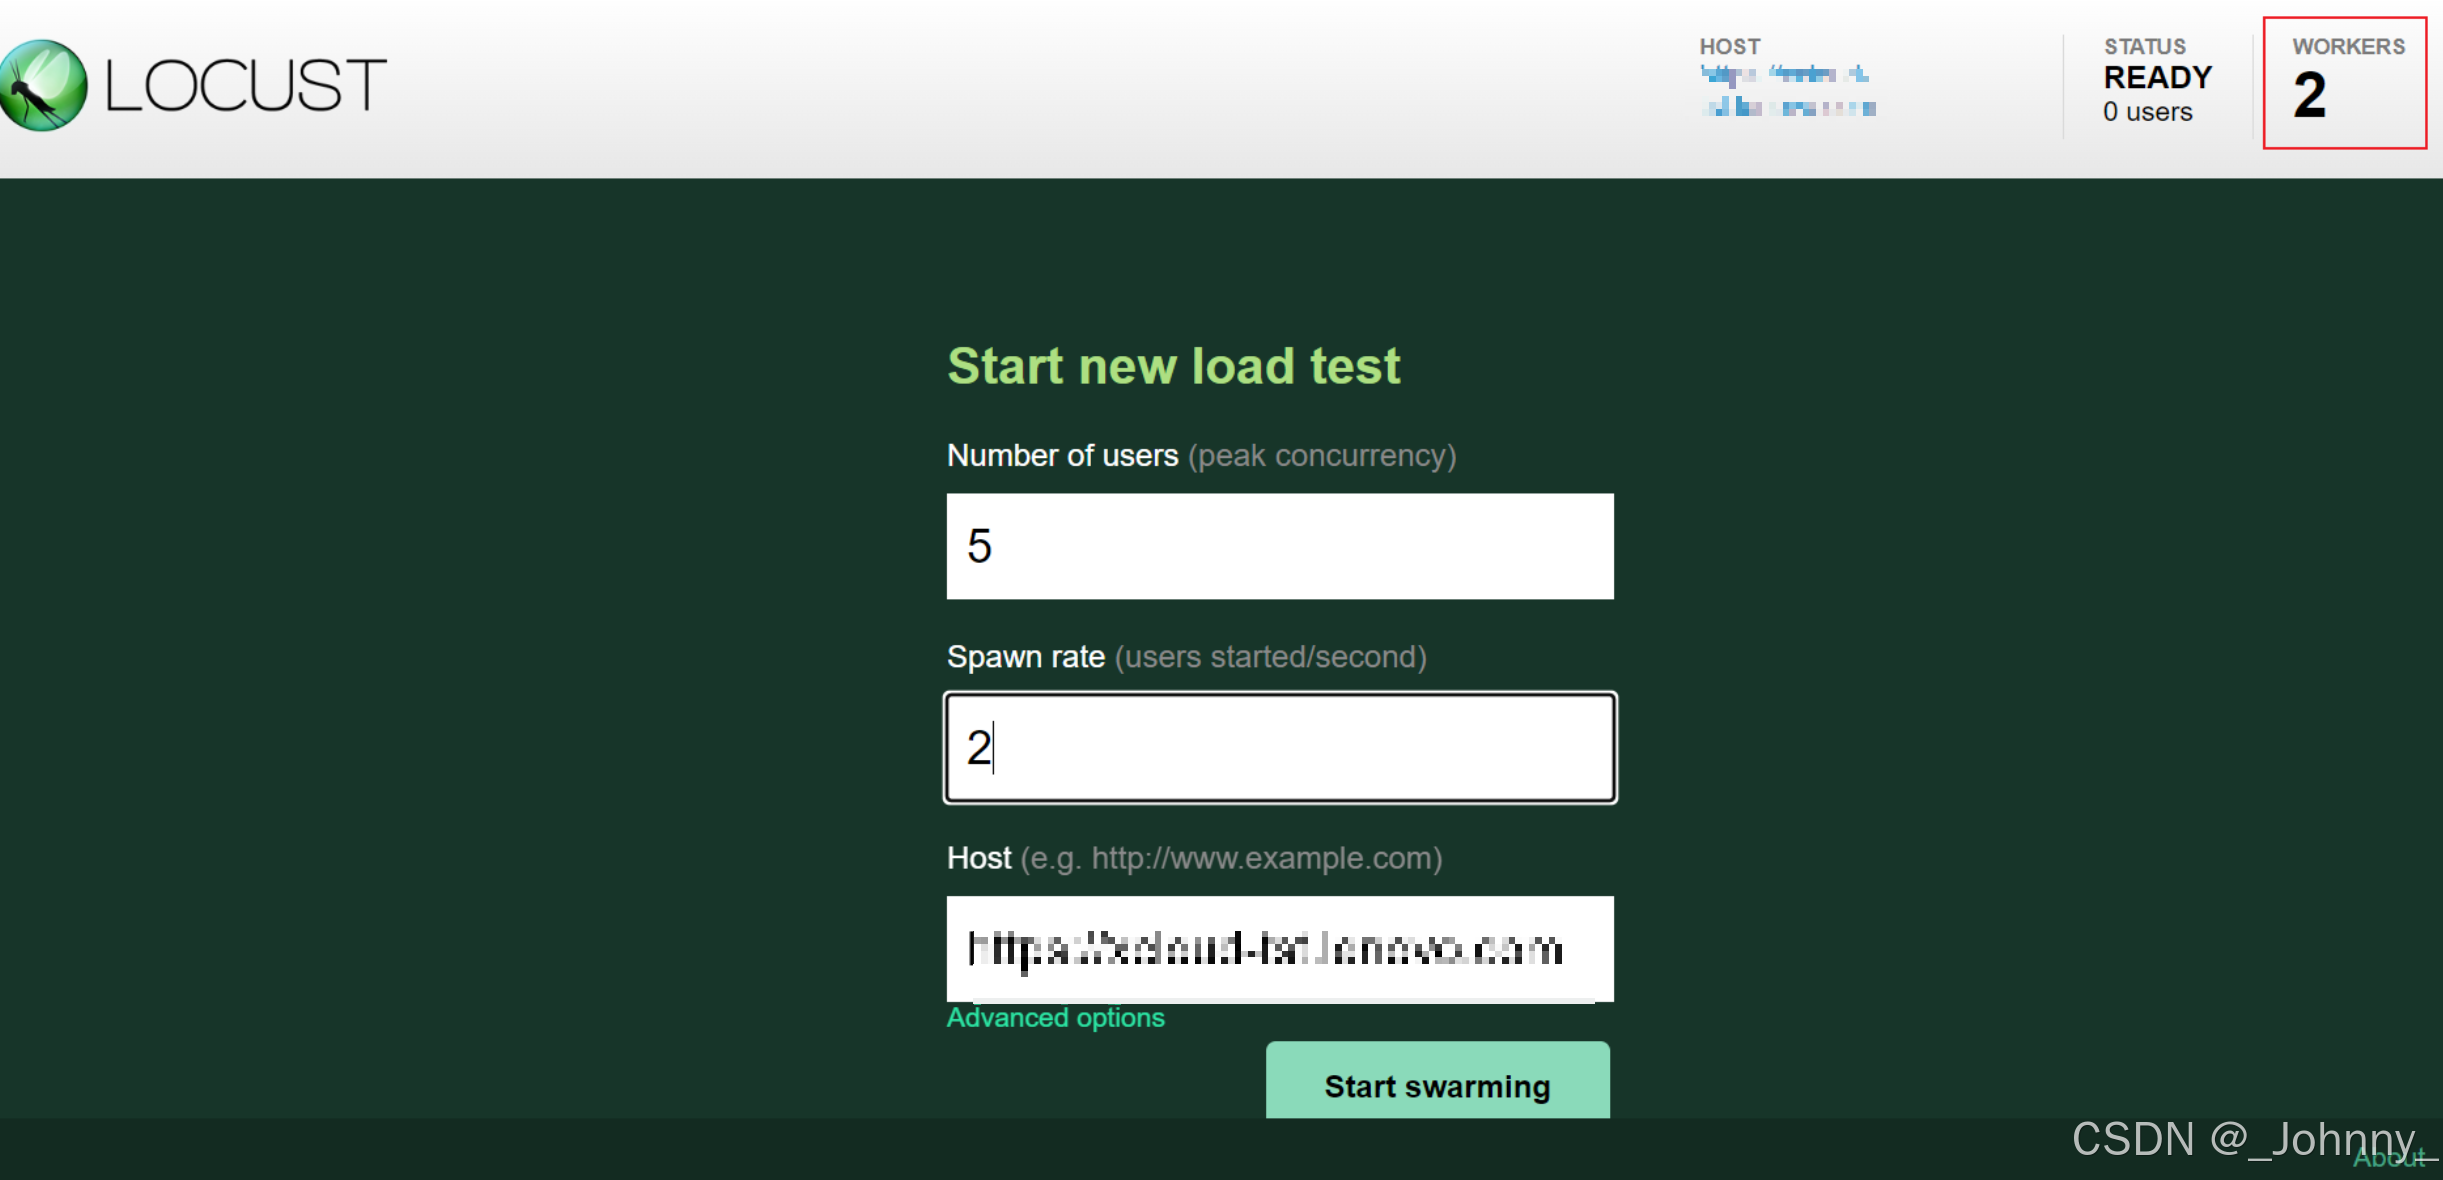
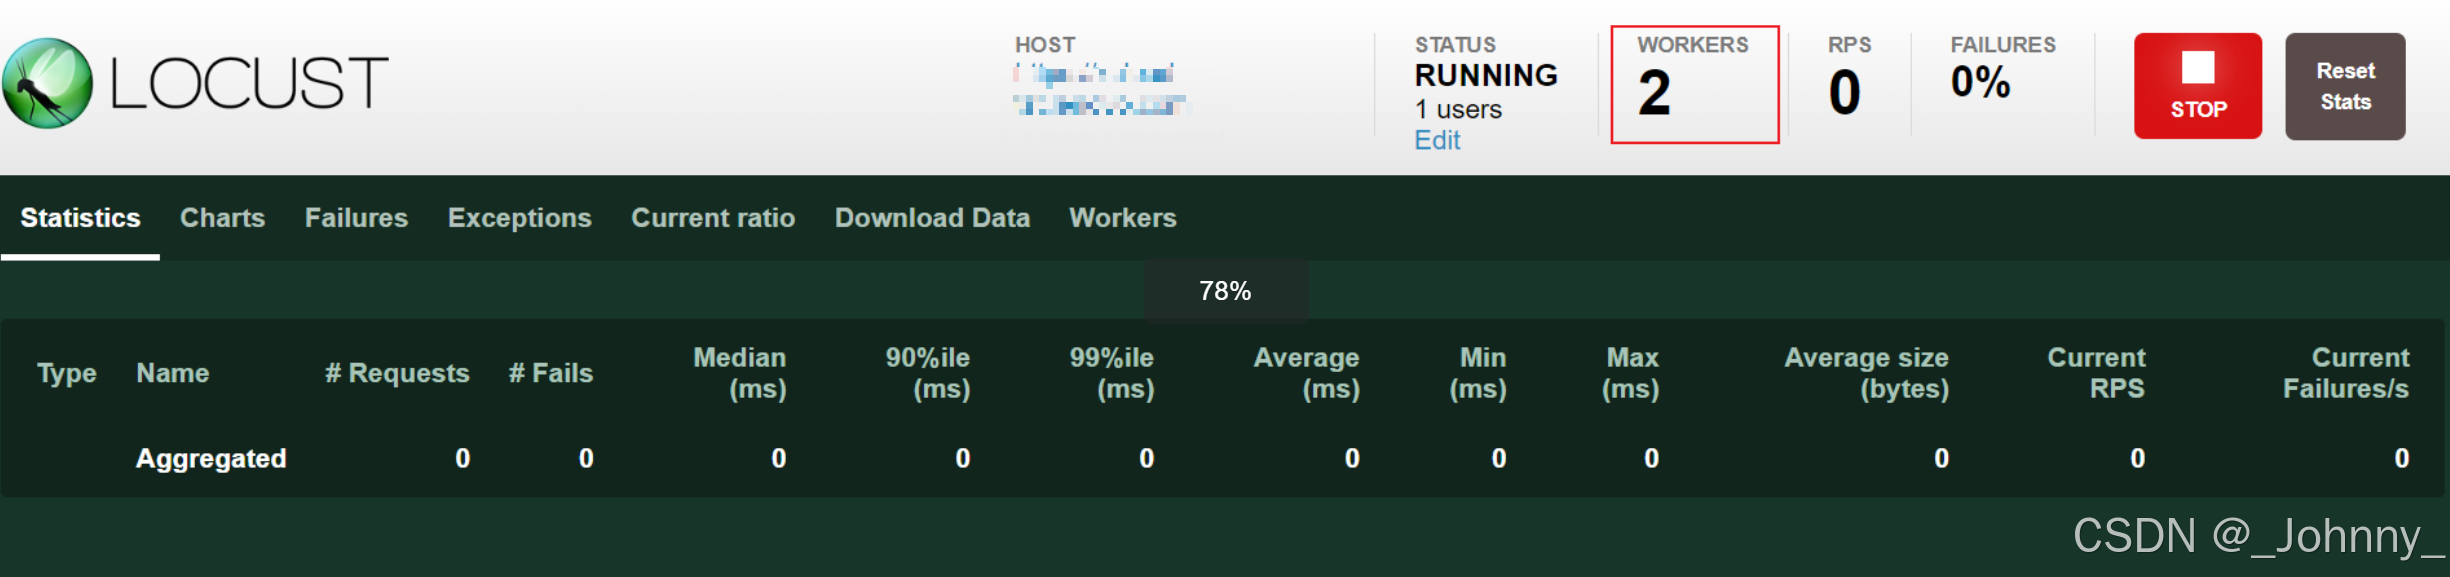
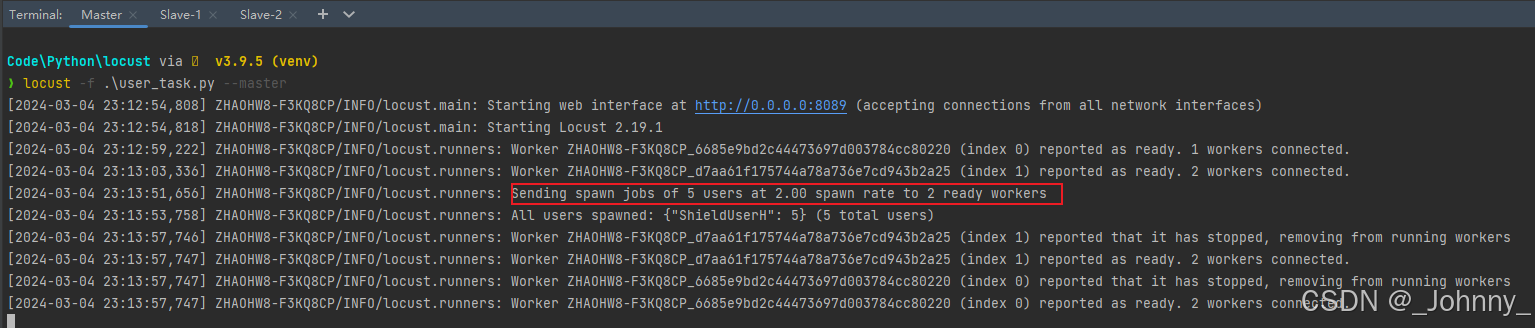
启动了一个 master 和两个 worker,由两个 worker来向被测试系统发送请求
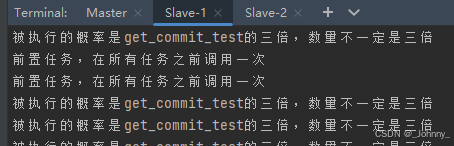
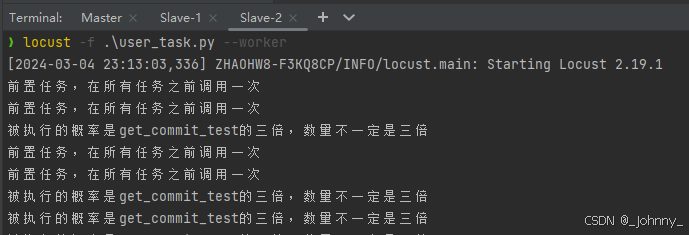
(4)执行在从节点:
2)基于命令行实现
Master节点(控制机):
locust -f 文件名 --master --headless -u 200 -r 20 --expect-workers 2 --run-time 20s --csv ./result.csv
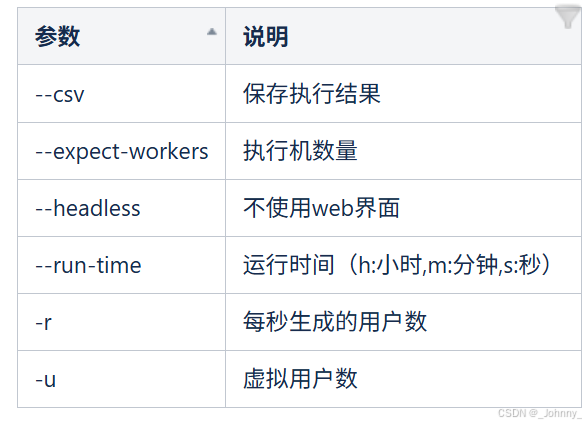

Worker从属主机(执行机):
locust -f 目录\执行文件名 --worker --master-host=主机ip地址 --master-port=主机端口
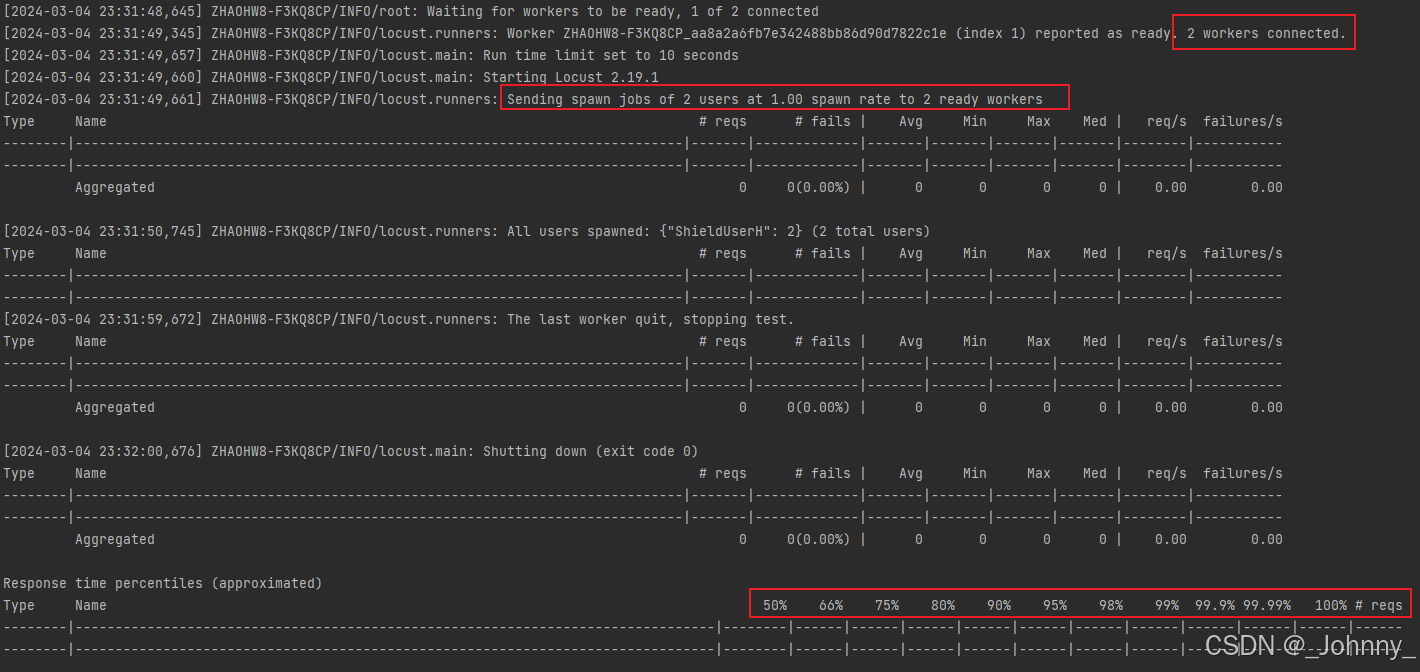
5、实际场景压测
场景一:用户多次查询产品列表和搜索产品,随机执行
场景二:用户进入一级模块菜单后多次搜索,顺序执行
实际应用示例
"""
@Author  :Johnny
@Desc    :
"""

import os
from locust import HttpUser, task, between, TaskSet, SequentialTaskSet, tag
import queue


# locust将为每一个user创建一个HttpSession的实例,HttpUser为每一个用户提供一个client属性,每个用户都相互独立
class ShieldProductTasks(TaskSet):
    """
    场景:用户多次查询产品列表和搜索产品,随机执行
    """

    @tag('list', 'get')  # 添加标签,可指定运行
    @task
    def get_product_list(self):
        PRODUCT_LIST_GET_API = '/shield/api/v1/product/'
        header = {
            'Authorization': self.client.token
        }
        response = self.client.get(PRODUCT_LIST_GET_API, headers=header)
        assert response.status_code == 200, f"Log out failed with status code {response.status_code}"
        print('===  run get_product_list,进入产品菜单')

    @tag('search')
    @task  # 被执行的概率和get_product_list的相同
    def search_product(self):
        PRODUCT_SEARCH_GET_API = '/shield/api/v1/product/?page=1&size=20&created_by=zhaohw8'
        header = {
            'Authorization': self.client.token
        }
        response = self.client.get(PRODUCT_SEARCH_GET_API, headers=header)
        assert response.status_code == 200, f"Log out failed with status code {response.status_code}"
        assert response.json().get('data') is not None, f'Data is None'
        print('===  run search_product,进行搜索')


class ShieldPrimaryModuleTasks(SequentialTaskSet):
    """
    场景:用户进入一级模块菜单后多次搜索,顺序执行
    """

    def on_start(self):
        print('task前置执行')

    def on_stop(self):
        print('task后置执行')

    @tag('get')
    @task
    def get_primary_module_list(self):
        RIMARY_MODULE_LIST_GET_API = '/shield/product/primarymodule'
        header = {
            'Authorization': self.client.token
        }
        response = self.client.get(RIMARY_MODULE_LIST_GET_API, headers=header)
        assert response.status_code == 200, f"Log out failed with status code {response.status_code}"
        print('===  run get_primary_module_list')

    @tag('search')
    @task(3)  # 被执行的概率是get_primary_module_list的三倍,相当于3倍的概率多次搜索
    def search_primary_module(self):
        user_para = 'zhaohw8'
        RIMARY_MODULE_SEARCH_GET_API = f'/shield/api/v1/primarymodule/?page=1&size=20&created_by={user_para}'
        header = {
            'Authorization': self.client.token
        }
        response = self.client.get(RIMARY_MODULE_SEARCH_GET_API, headers=header)
        assert response.status_code == 200, f"Log out failed with status code {response.status_code}"
        assert response.json().get('data') is not None, f'Data is None'
        print(f'===  run search_primary_module')
        # print(response.json().get('data') )

    # locust会执行task修饰过的方法,未被修饰不会被执行
    def search_primary_module_with_queue(self):
        user_para = self.user.queue_data.get()
        RIMARY_MODULE_SEARCH_GET_API = f'/shield/api/v1/primarymodule/?page=1&size=20&created_by={user_para}'
        header = {
            'Authorization': self.client.token
        }
        response = self.client.get(RIMARY_MODULE_SEARCH_GET_API, headers=header)
        assert response.status_code == 200, f"Log out failed with status code {response.status_code}"
        assert response.json().get('data') is not None, f'Data is None'
        print(f'===  run search_primary_module, search:{user_para}')

    # 模拟异常,缺少参数
    @task
    def search_primary_module_with_queue_except(self):
        RIMARY_MODULE_SEARCH_GET_API = f'/shield/api/v1/primarymodule/?page=1&size=20&created_by={user_para}'
        header = {
            # 'Authorization': self.client.token
        }
        response = self.client.get(RIMARY_MODULE_SEARCH_GET_API, headers=header)
        assert response.status_code == 200, f"Log out failed with status code {response.status_code}"
        assert response.json().get('data') is not None, f'Data is None'
        print(f'===  run search_primary_module, search fail')

    # 模拟异常,接口错误
    @task
    def search_primary_module_with_queue_fail(self):
        RIMARY_MODULE_SEARCH_GET_API = f'/shield/api/v1/primarymodule1/?page=1&size=20'
        header = {
            # 'Authorization': self.client.token
        }
        response = self.client.get(RIMARY_MODULE_SEARCH_GET_API, headers=header)
        assert response.status_code == 200, f"Log out failed with status code {response.status_code}"
        assert response.json().get('data') is not None, f'Data is None'
        print(f'===  run search_primary_module, search except')


def para_config():
    queue_para = queue.Queue()  # 实例化一个queue对象
    with open("user.txt", "r") as f:
        for user_para in f:
            try:
                queue_para.put_nowait(user_para)  # put到队列中
            except queue.Full:
                print("Queue overflow")
        return queue_para


class ShieldUser(HttpUser):
    # wait_time = between(0.5, 1)  # wait_time属性可以让user在执行一个任务之后进行延迟,模拟真实反应时间,单位秒
    # min_wait = 100               # 任务间最小等待时间,单位毫秒
    # max_wait = 5000              # 任务间最大等待时间,单位毫秒
    host = 'https://xcloud-tst.lenovo.com'
    queue_data = para_config()  # 队列实例化
    # list方式:随机选择执行
    tasks = [ShieldPrimaryModuleTasks]
    # tasks = [ShieldProductTasks]

    # dict方式:根据概进行随机执行
    # tasks = {ShieldPrimaryModuleTasks:2,ShieldProductTasks:1}

    # 虚拟用户启动task时运行
    def on_start(self):
        print('-----------  Login Governance')
        login_governance_url = '/governance/api/v1/auth/login?location='
        body = {
            "authConfigId": 1234,
            "captchaCode": '',
            "captchaId": '',
            "loginName": "*******",
            "password": "***********",
            "iv": "*************"
        }
        response = self.client.post(login_governance_url, json=body)
        assert response.status_code == 200, f"Login failed with status code {response.status_code}"
        self.client.token = f"Bearer {response.json().get('data').get('authToken')}"

    # 虚拟用户结束task时运行
    def on_stop(self):
        # logout_governance_url = '/governance/api/v1/auth/logout'
        # body = {}
        # self.client.post(logout_governance_url, json=body)
        # response = self.client.post(logout_governance_url, json=body)
        # assert response.status_code == 401, f"Log out failed with status code {response.status_code}"
        print('-----------  Log out Governance')
        # print(response.json())
        # print(response.status_code)


if __name__ == '__main__':
    # os.system('locust --tags search')       # 指定标签执行,无限执行
    # os.system('locust --tags get -t 10')    # 指定执行时间10秒
    os.system('locust -t 30s')  # 采用默认文件名运行,locustfile
6、测试报告
1)性能测试报告菜单
Locust提供了多个页面用于查看测试结果:
- Statistics:统计信息页面,显示请求的详细统计数据
- Charts:图表页面,实时显示测试过程中的性能指标
- Failures:失败页面,显示所有失败的请求信息
- Exceptions:异常页面,显示测试过程中的异常信息
- Current ratio:当前比例页面,显示用户分布情况
- Download Data:数据下载页面,可以下载CSV格式的测试数据
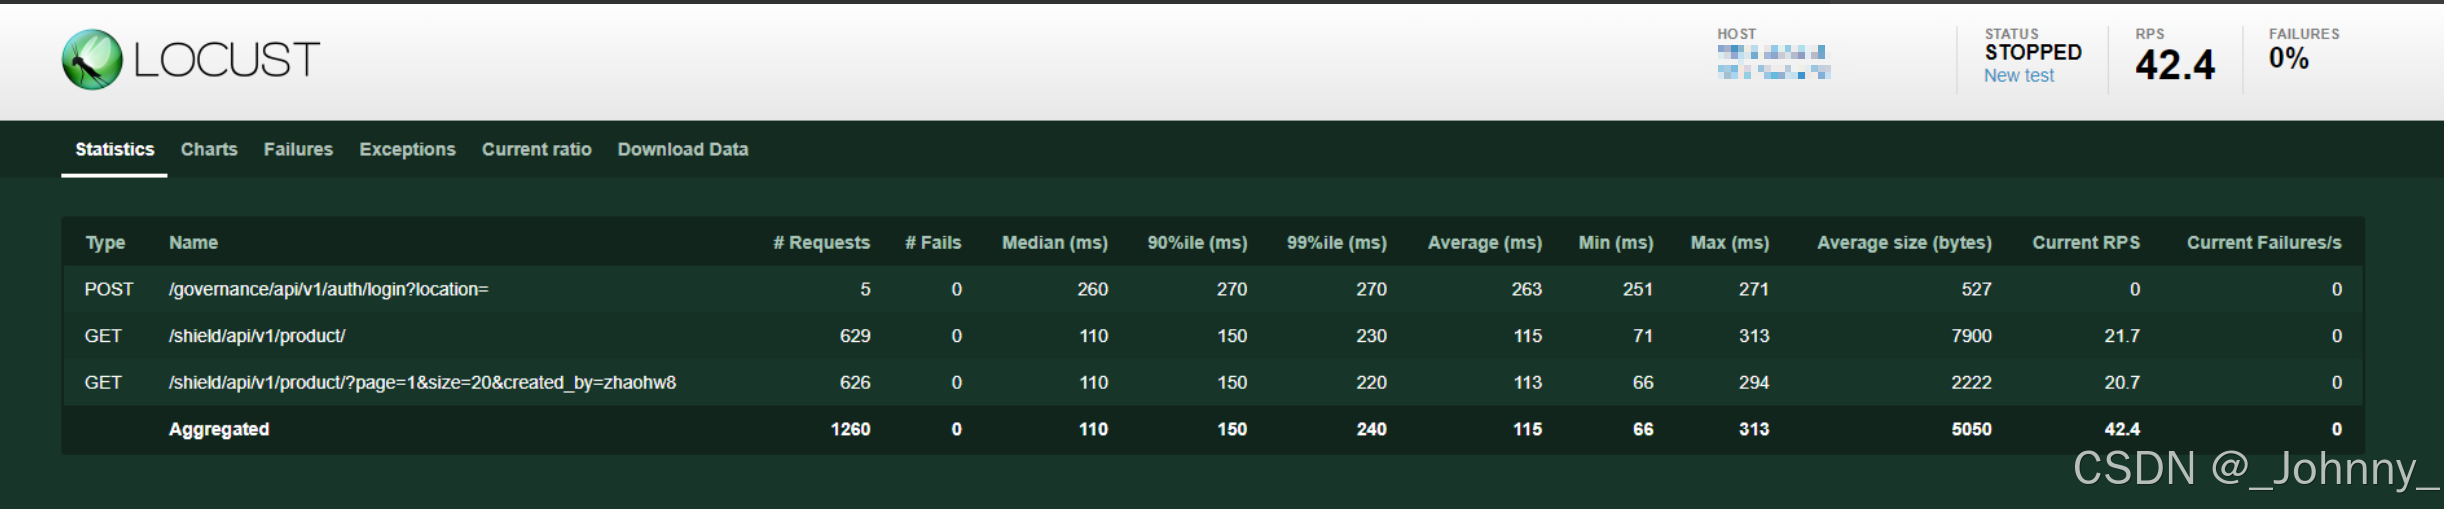
2)Statistics聚合报告解析
Statistics页面包含以下关键指标:
- Type:请求类型(HTTP方法)
- Name:请求名称/URL
- # Requests:请求总数
- # Failures:失败请求数
- Median:响应时间中位数
- 95%ile:95%的请求响应时间
- 99%ile:99%的请求响应时间
- Average:平均响应时间
- Min:最小响应时间
- Max:最大响应时间
- Average Size:平均响应大小
- Current RPS:当前每秒请求数
- Current Failures/s:当前每秒失败数
主要就这四个指标:并发数、RPS、响应时间、异常率。
关于RPS:
RPS(Request Per Second),字面意思即每秒请求数。一般我们将它理解为一个HTTP请求。如果一个事务只有一个接口,那么TPS=RPS,如果这个接口是查询接口,那么TPS=RPS=QPS。
关于TPS:
TPS(Transactions Per Second ),字面意思即每秒处理事务数,以业务A为例, 发起登录请求-后端处理请求-返回前端页面就是一整个事务,如果一秒钟能处理N个这样的流程,那么TPS就是N/S
关于QPS:
QPS(Queries Per Second),字面意思即每秒查询数。其实这个最早大部分时候被用来描述数据库中SQL的查询性能,后面也有人用它描述请求,用请求来计算的话,就不包含插入、更新、删除操作了,只针对查询接口。一般对于一个事务访问,会形成一个 “ T ”;但一次 " T " 中,可能产生多次对服务器的请求,服务器对这些请求,就可计入 QPS 之中。例如在业务A中,除了接口还有其它页面资源信息,一次请求包括css.css,script.js以及api,向服务器发起了3次请求,那么QPS=3。
3)图表展示
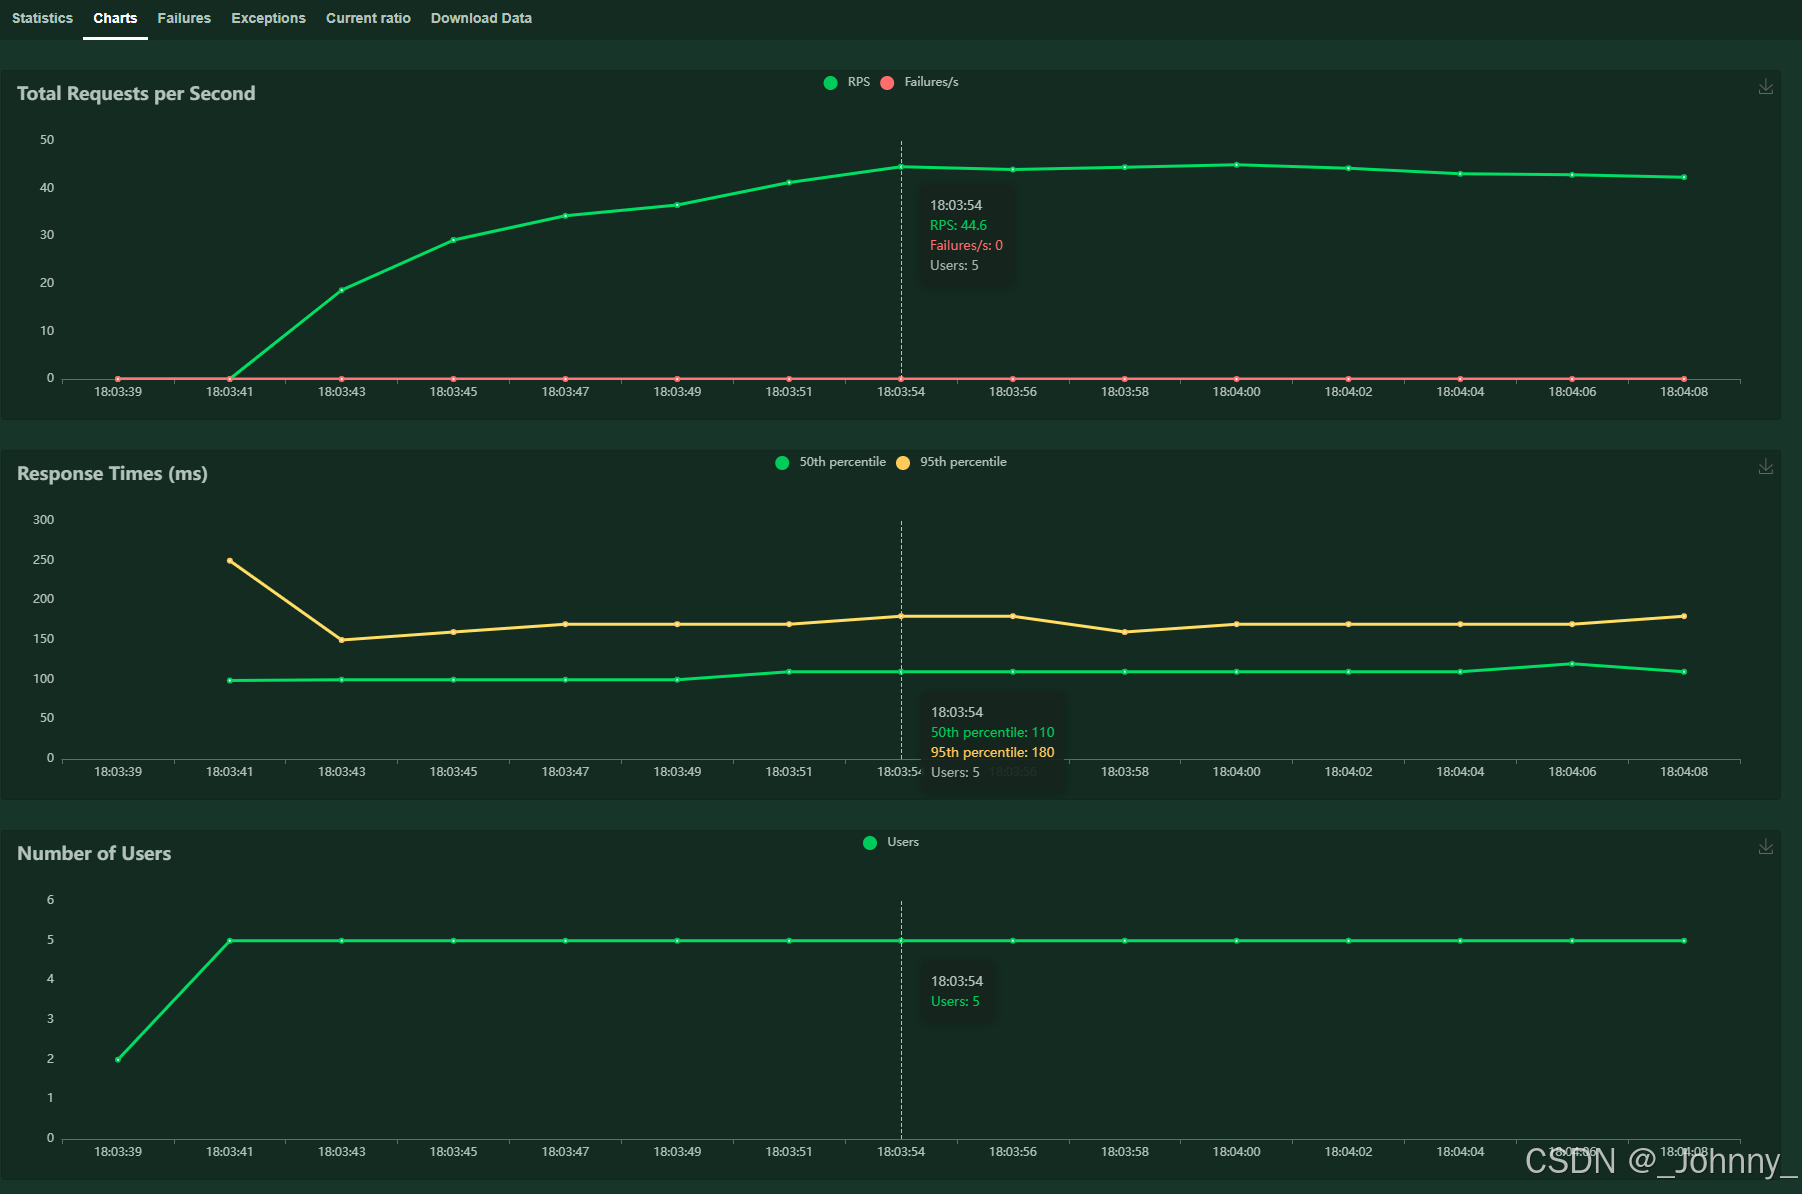
Charts页面提供实时图表:
- Total Requests per Second:每秒总请求数,每秒完成的请求数(RPS):衡量系统的处理能力和吞吐量
- Response Times (ms):响应时间分布
- Number of Users:用户数变化
- Failures per Second:每秒失败数
注意:图表数据是非持久化存储的,刷新后波动图就清空了。
关于吞吐量:
用于衡量网络成功传输的数据量,单位是Byte/s,一个系统的吞度量(承压能力)与request对CPU的消耗、外部介面、IO等等紧密关联。单个reqeust 对CPU消耗越高,外部系统介面、IO影响速度越慢,系统吞吐能力越低,反之越高。也就是说吞吐量一般要根据实际情况看与什么指标关联性更大来判断系统的承受能力。
4)Failures失败请求展示

显示所有失败请求的详细信息:
- 失败的请求URL
- 失败次数
- 失败类型
- 错误信息
5)Exceptions异常请求展示
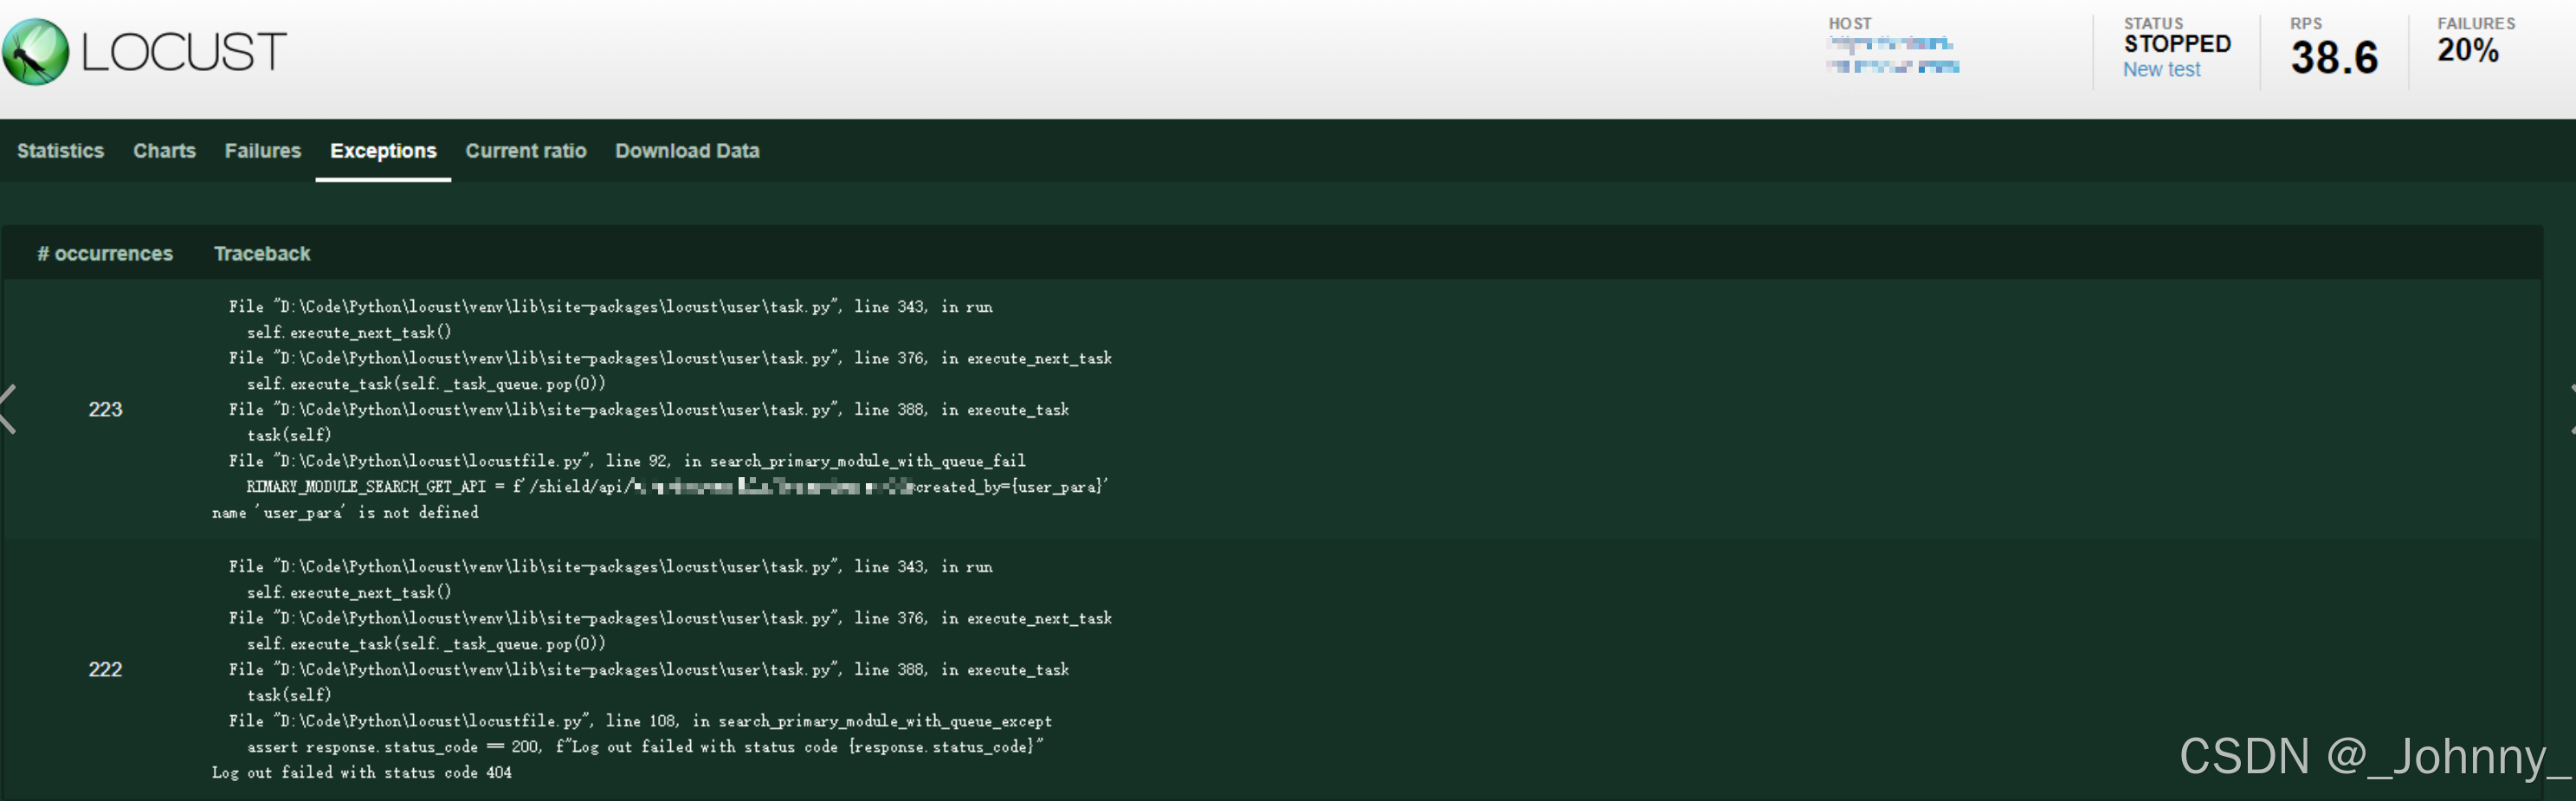
显示测试过程中发生的异常:
- 异常类型
- 发生次数
- 异常堆栈信息
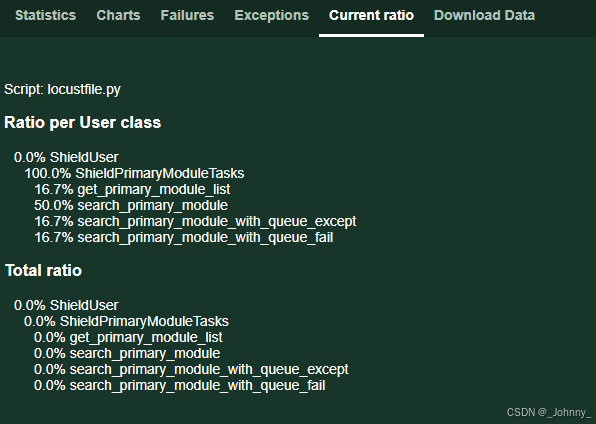
6)Current ratio流量比
显示不同用户类的分布比例和当前状态。
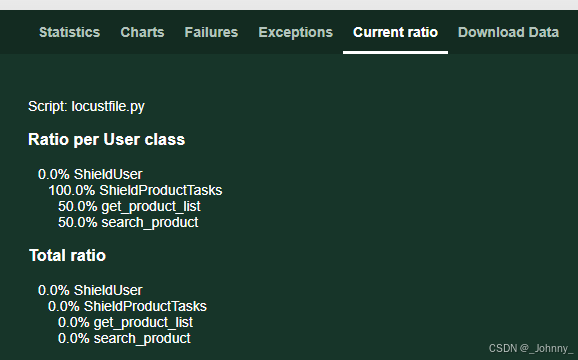
7)数据报告
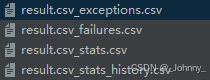
三个CSV报告(request statistics CSV、failures CSV、exceptions CSV)和Report测试报告
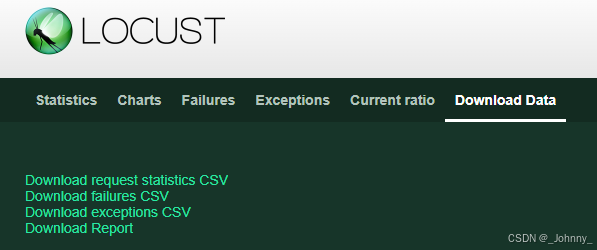
测试报告,数据进行汇总
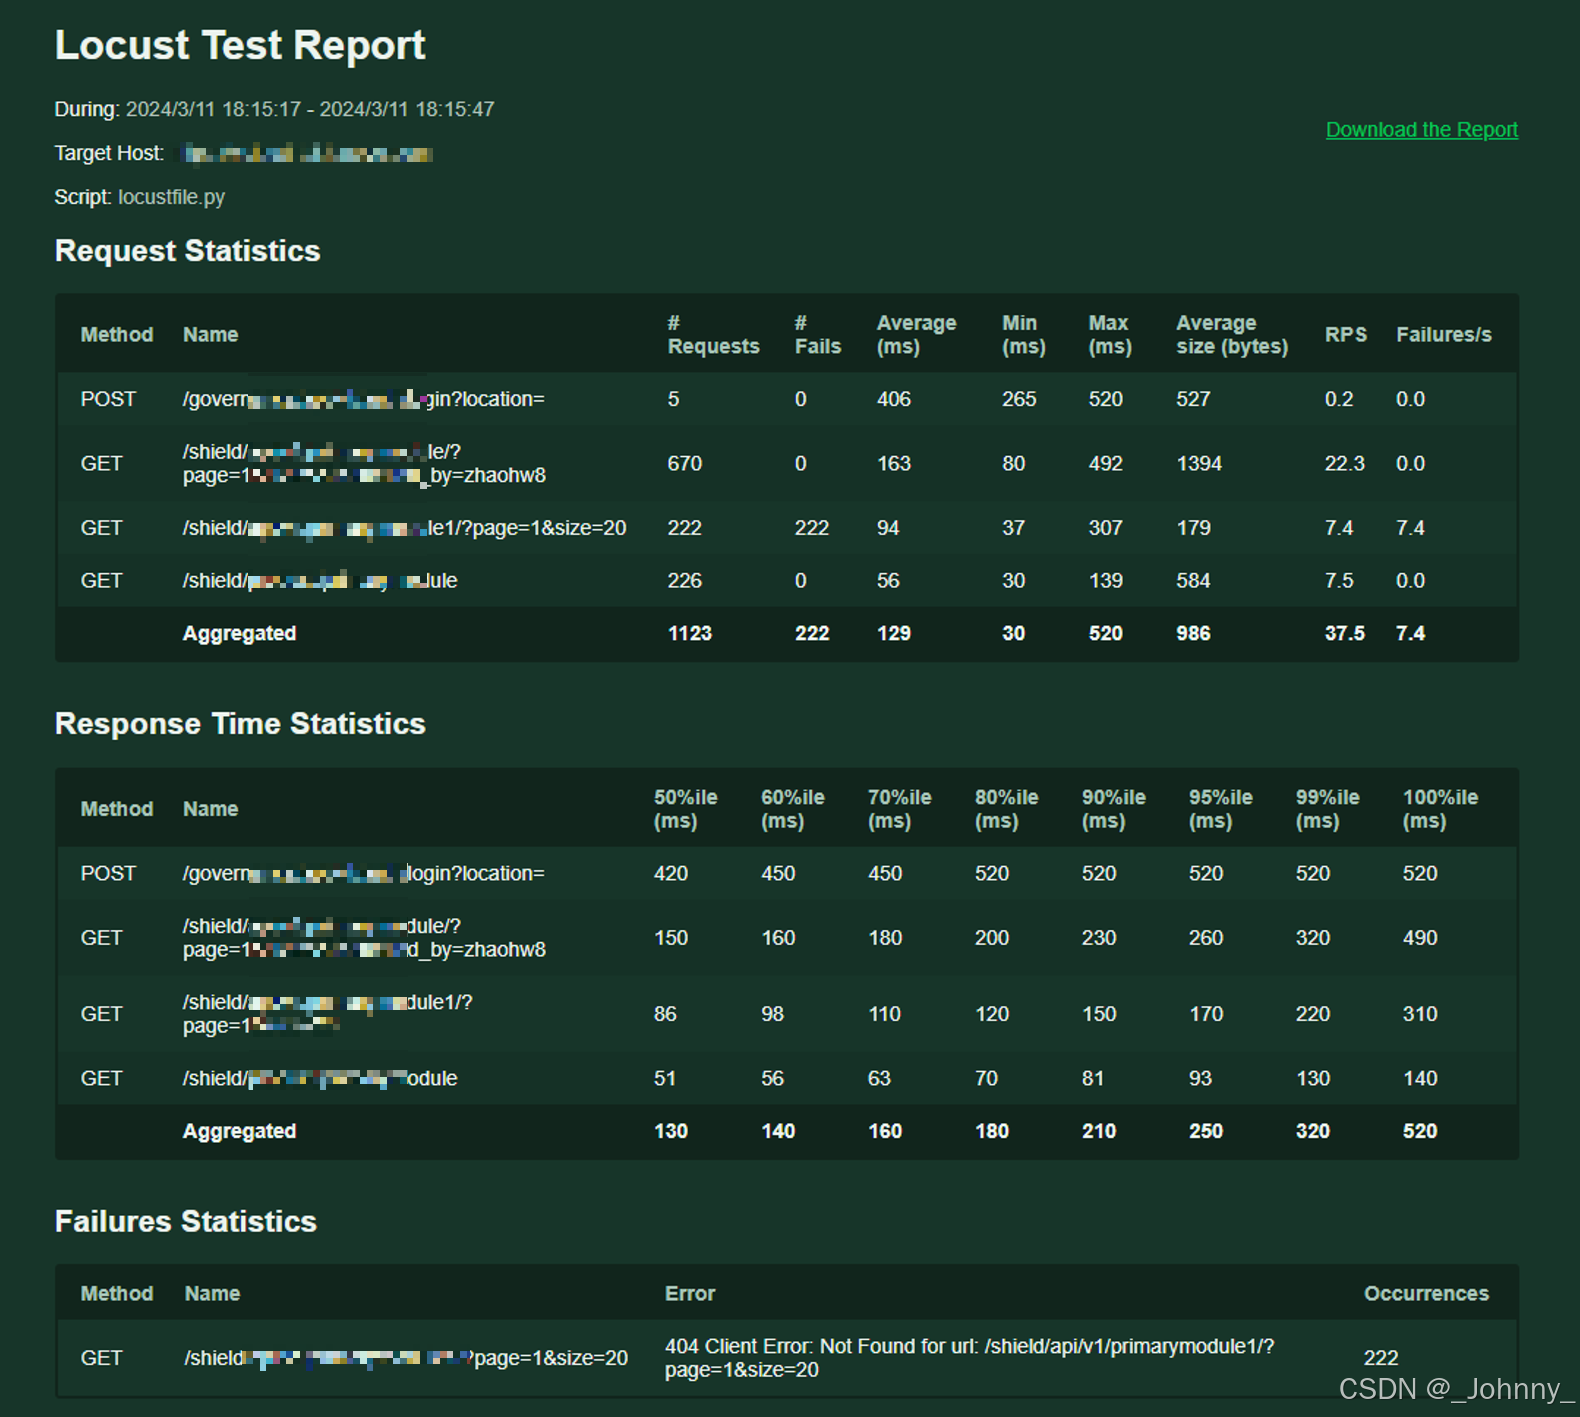
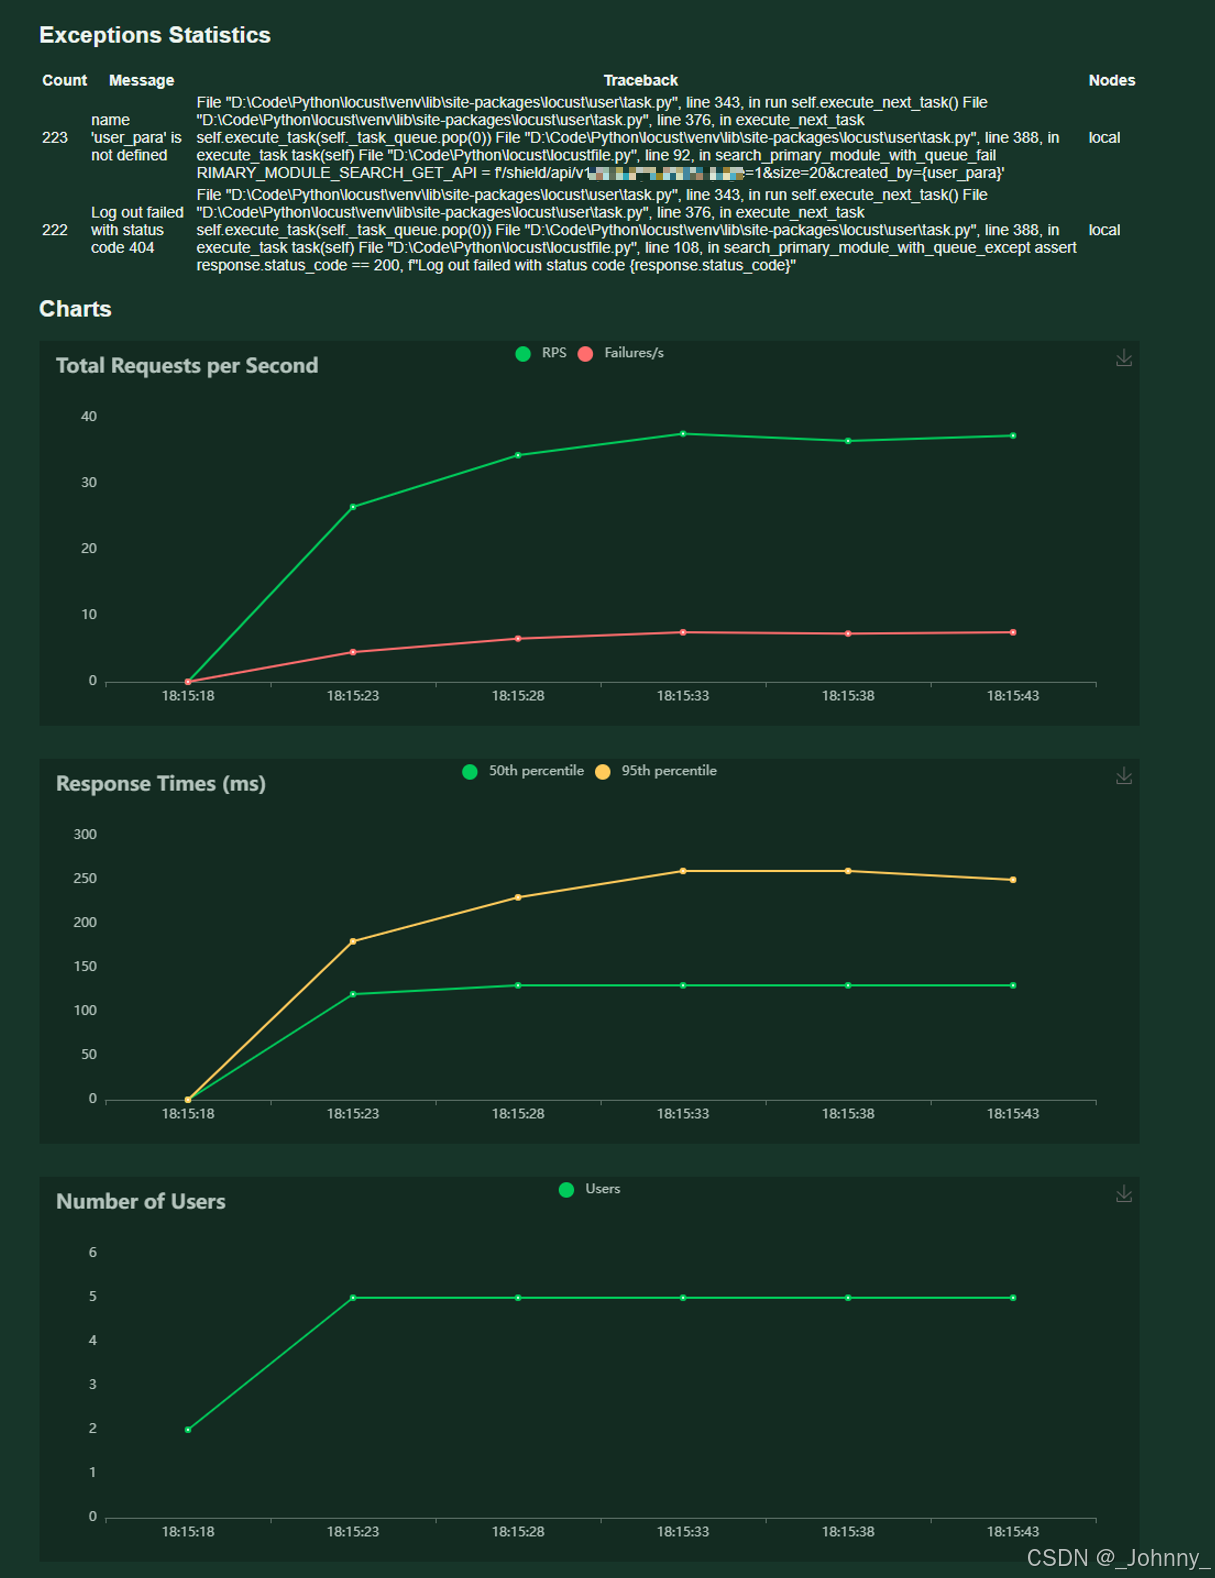

可以下载以下格式的测试数据:
- CSV:统计数据、历史数据、失败数据
- HTML:完整的测试报告
- JSON:测试统计数据
下载命令示例:
# 生成CSV报告
locust -f locustfile.py --headless -u 100 -r 10 -t 60s --csv=example

# 生成HTML报告
locust -f locustfile.py --headless -u 100 -r 10 -t 60s --html=report.html
六、扩展
1、增强性能监控
Locust虽然提供了跨平台的web模式的性能监控和展示,但是有以下明显缺陷:
- rps、平均响应时间波动图没有持久化存储,刷新后便丢失
- 整体统计信息只是表格的形式,不能体现波动时序
- 测试报告过于简陋且只有文字版,只能下载存档
方案:实现一个Locust的prometheus的exporter,将数据导入prometheus,然后使用grafana进行数据展示,参考Locust+Prometheus+Grafana 搭建性能监控平台
集成监控工具
与InfluxDB + Grafana集成:
import time
from locust import events
from influxdb import InfluxDBClient

class InfluxDBListener:
    def __init__(self, influx_host='localhost', influx_port=8086, database='locust'):
        self.client = InfluxDBClient(host=influx_host, port=influx_port, database=database)

    def request_handler(self, request_type, name, response_time, response_length, exception, **kwargs):
        if exception:
            status = "fail"
        else:
            status = "pass"

        point = {
            "measurement": "locust_requests",
            "time": int(time.time() * 1000000000),
            "fields": {
                "response_time": response_time,
                "response_length": response_length
            },
            "tags": {
                "request_type": request_type,
                "name": name,
                "status": status
            }
        }
        self.client.write_points([point])

# 注册事件监听器
influx_listener = InfluxDBListener()
events.request.add_listener(influx_listener.request_handler)
与Prometheus集成:
from prometheus_client import Counter, Histogram, start_http_server
from locust import events

# 定义Prometheus指标
REQUEST_COUNT = Counter('locust_requests_total', 'Total requests', ['method', 'endpoint', 'status'])
REQUEST_DURATION = Histogram('locust_request_duration_seconds', 'Request duration', ['method', 'endpoint'])

def prometheus_request_handler(request_type, name, response_time, response_length, exception, **kwargs):
    status = "success" if exception is None else "failure"
    REQUEST_COUNT.labels(method=request_type, endpoint=name, status=status).inc()
    REQUEST_DURATION.labels(method=request_type, endpoint=name).observe(response_time / 1000)

# 启动Prometheus metrics服务器
start_http_server(9090)
events.request.add_listener(prometheus_request_handler)
2、扩展Locust
Locust本身比较简单,如果想要更多的特性,需要Pugins,参考locust-plugins
如:
- Playwright
- WebSockets/SocketIO
- Selenium/Webdriver
- HTTP users that load html page resources
- Kafka
- MqttUser
- RestUser has been removed, as it is now part of locust core!
自定义User类
import time
from locust import User, task, events

class DatabaseUser(User):
    """自定义数据库用户类"""

    def __init__(self, environment):
        super().__init__(environment)
        # 初始化数据库连接
        self.db_connection = self.connect_to_database()

    def connect_to_database(self):
        # 实现数据库连接逻辑
        pass

    @task
    def query_database(self):
        start_time = time.time()
        try:
            # 执行数据库查询
            result = self.db_connection.execute("SELECT * FROM users LIMIT 10")
            total_time = int((time.time() - start_time) * 1000)

            # 触发请求事件,用于统计
            events.request.fire(
                request_type="Database",
                name="SELECT users",
                response_time=total_time,
                response_length=len(result) if result else 0,
                exception=None
            )
        except Exception as e:
            total_time = int((time.time() - start_time) * 1000)
            events.request.fire(
                request_type="Database",
                name="SELECT users",
                response_time=total_time,
                response_length=0,
                exception=e
            )
自定义协议支持
import socket
import time
from locust import User, task, events

class TCPUser(User):
    """TCP协议用户类"""

    def __init__(self, environment):
        super().__init__(environment)
        self.socket = None

    def on_start(self):
        self.socket = socket.socket(socket.AF_INET, socket.SOCK_STREAM)
        self.socket.connect((self.host, 8080))

    def on_stop(self):
        if self.socket:
            self.socket.close()

    @task
    def send_message(self):
        start_time = time.time()
        message = "Hello, TCP Server!"

        try:
            self.socket.send(message.encode())
            response = self.socket.recv(1024).decode()

            total_time = int((time.time() - start_time) * 1000)
            events.request.fire(
                request_type="TCP",
                name="send_message",
                response_time=total_time,
                response_length=len(response),
                exception=None
            )
        except Exception as e:
            total_time = int((time.time() - start_time) * 1000)
            events.request.fire(
                request_type="TCP",
                name="send_message",
                response_time=total_time,
                response_length=0,
                exception=e
            )
事件钩子和插件开发
from locust import events
import logging

# 设置日志
logger = logging.getLogger(__name__)

@events.test_start.add_listener
def on_test_start(environment, **kwargs):
    """测试开始时执行"""
    logger.info("Load test starting...")
    # 可以在这里初始化测试环境、发送通知等

@events.test_stop.add_listener
def on_test_stop(environment, **kwargs):
    """测试结束时执行"""
    logger.info("Load test ending...")
    # 可以在这里清理资源、发送测试报告等

@events.user_add.add_listener
def on_user_add(environment, **kwargs):
    """用户增加时执行"""
    logger.info(f"User added. Total users: {environment.runner.user_count}")

@events.user_remove.add_listener
def on_user_remove(environment, **kwargs):
    """用户减少时执行"""
    logger.info(f"User removed. Total users: {environment.runner.user_count}")

@events.request.add_listener
def on_request(request_type, name, response_time, response_length, exception, **kwargs):
    """每个请求完成时执行"""
    if exception:
        logger.error(f"Request failed: {name}, Exception: {exception}")
    else:
        logger.debug(f"Request success: {name}, Response time: {response_time}ms")
自定义负载模式
from locust import LoadTestShape

class StagesShape(LoadTestShape):
    """
    阶梯式负载模式
    """
    stages = [
        {"duration": 60, "users": 10, "spawn_rate": 10},
        {"duration": 120, "users": 50, "spawn_rate": 10},
        {"duration": 180, "users": 100, "spawn_rate": 10},
        {"duration": 240, "users": 50, "spawn_rate": 10},
        {"duration": 300, "users": 0, "spawn_rate": 10},
    ]

    def tick(self):
        run_time = self.get_run_time()

        for stage in self.stages:
            if run_time < stage["duration"]:
                tick_data = (stage["users"], stage["spawn_rate"])
                return tick_data

        return None

class PeakShape(LoadTestShape):
    """
    峰值负载模式
    """
    def tick(self):
        run_time = self.get_run_time()

        if run_time < 300:
            # 前5分钟逐渐增加到100用户
            user_count = int(run_time / 3)
            return (user_count, 2)
        elif run_time < 600:
            # 5-10分钟保持100用户
            return (100, 2)
        elif run_time < 900:
            # 10-15分钟逐渐减少到0
            user_count = 100 - int((run_time - 600) / 3)
            return (max(user_count, 0), 2)
        else:
            # 停止测试
            return None
七、总结
Locust作为一个基于Python的现代化性能测试工具,在以下方面表现突出:
优势
- 易于使用:Python语法简单,学习成本低
- 高度灵活:可以编写复杂的测试逻辑和自定义协议
- 分布式支持:轻松实现大规模分布式测试
- 实时监控:Web界面提供实时性能数据
- 可扩展性:丰富的扩展机制和插件支持
- 资源效率:基于协程的并发模型,资源占用较少
适用场景
- API性能测试:RESTful API、GraphQL等
- Web应用测试:网站性能和负载测试
- 微服务测试:分布式系统的性能验证
- CI/CD集成:自动化性能测试流水线
- 容量规划:系统容量评估和优化
最佳实践
- 逐步增加负载:使用合理的spawn rate避免系统冲击
- 监控系统资源:同时监控应用服务器和数据库性能
- 设置合理的等待时间:模拟真实用户行为
- 使用参数化数据:避免测试数据重复造成的偏差
- 分布式部署:对于大规模测试使用多节点部署
- 结果分析:关注响应时间分布而不仅仅是平均值
Locust是一个功能强大且易于使用的性能测试工具,特别适合需要灵活性和可扩展性的测试场景。通过合理的使用和扩展,可以满足大多数性能测试需求。
个人想法
JMeter和Locust都是强大的性能测试工具。
如果项目涉及复杂的测试场景、多种协议或需要丰富的图形化配置,JMeter可能是更合适的选择,毕竟插件、教程很多,支持的内容不仅全面,而且对不熟悉编程人也更容易上手。
如果项目注重轻量级的负载需求,或者代码是基于python脚本编写的,Locust可能更适合,毕竟比较简单、可扩展、资源占用小。
更多推荐



 26
26 0
0- 0


 已为社区贡献2条内容

所有评论(0)