
uniapp-vue2使用echarts图表-兼容H5和App
·
一. 下载echarts@4.2.1版本库
/components/echarts/echarts.min.js
链接: https://pan.baidu.com/s/1DQne9hCpVo1qIq8_W7m_uQ?pwd=7fcr
二. 定义components组件
/components/echarts/echarts.vue
<template>
	<view>
		<view class="echarts" :id="option.id" :prop="option" :change:prop="echarts.update" @click="echarts.onClick"
			:change:id="echarts.getId">
		</view>
	</view>
</template>

<script>
	export default {
		name: 'Echarts',
		props: {
			option: {
				type: Object,
				required: true
			}
		},
		created() {
			// 设置随机数id
			let t = 'ABCDEFGHIJKLMNOPQRSTUVWXYZabcdefghijklmnopqrstuvwxyz0123456789'
			let len = t.length
			let id = ''
			for (let i = 0; i < 32; i++) {
				id += t.charAt(Math.floor(Math.random() * len))
			}
			this.option.id = id
		},
		methods: {
			/**
			 * renderjs内的点击事件,回调到父组件
			 * @param {Object} params
			 */
			onViewClick(params) {
				this.$emit('click', params)
			}
		}
	}
</script>

<script module="echarts" lang="renderjs">
	// 本地引入
	// import echarts from '@/components/echarts/echarts.min.js'
	let temp_id = ''
	let optionData = {}
	export default {
		data() {
			return {
				chart: null,
				clickData: null // echarts点击事件的值
			}
		},
		mounted() {
			// 本地引入
			// this.init();

			// cdn引入
			this.importEcharts()
		},
		methods: {
			getId(id) {
				temp_id = id
			},
			importEcharts() {
				if (typeof window.echarts === 'object') {
					this.init()
				} else {
					// 动态引入类库
					const script = document.createElement('script')
					script.type = "text/javascript";
					// script.src = 'https://cdn.jsdelivr.net/npm/echarts@4.2.1/dist/echarts.min.js' // 别人的
					script.src = 'https://p.qjyiot.com/js/echarts.min.js'
					script.onload = this.init.bind(this)
					document.head.appendChild(script)
				}
			},
			/**
			 * 初始化echarts
			 */
			async init() {
				// 根据id初始化图表
				this.chart = await echarts.init(document.getElementById(temp_id))
				this.update(optionData)
				// echarts的点击事件
				this.chart.on('click', params => {
					// 把点击事件的数据缓存下来
					this.clickData = params
				})
			},
			/**
			 * 点击事件,可传递到外部
			 * @param {Object} event
			 * @param {Object} instance
			 */
			onClick(event, instance) {
				if (this.clickData) {
					// 把echarts点击事件相关的值传递到renderjs外
					instance.callMethod('onViewClick', {
						value: this.clickData.data,
						name: this.clickData.name,
						seriesName: this.clickData.seriesName
					})
					// 上次点击数据置空
					this.clickData = null
				}
			},
			/**
			 * 监测数据更新
			 * @param {Object} option
			 */
			update(option) {
				optionData = option
				if (this.chart) {
					// 因App端,回调函数无法从renderjs外传递,故在此自定义设置相关回调函数
					if (option.id) {
						// tooltip
						if (option.tooltip) {
							// 判断是否设置tooltip的位置
							if (option.tooltip.positionStatus) {
								option.tooltip.position = this.tooltipPosition()
							}
							// 判断是否格式化tooltip
							if (option.tooltip.formatterStatus) {
								option.tooltip.formatter = this.tooltipFormatter(option.tooltip.formatterUnit, option
									.tooltip.formatFloat2, option.tooltip.formatThousands)
							}
						}
						// #ifdef APP-PLUS
						if (option.legend.formatterSign) {
							option.legend.formatter = this.legendFormatter()
						}
						// #endif
					}
					// 设置新的option
					this.chart.setOption(option, option.notMerge)
				}
			},
			/**
			 * 设置tooltip的位置,防止超出画布
			 */
			tooltipPosition() {
				return (point, params, dom, rect, size) => {
					// 其中point为当前鼠标的位置,size中有两个属性:viewSize和contentSize,分别为外层div和tooltip提示框的大小
					let x = point[0]
					let y = point[1]
					let viewWidth = size.viewSize[0]
					let viewHeight = size.viewSize[1]
					let boxWidth = size.contentSize[0]
					let boxHeight = size.contentSize[1]
					let posX = 0 // x坐标位置
					let posY = 0 // y坐标位置
					if (x >= boxWidth) { // 左边放的下
						posX = x - boxWidth - 1
					}
					if (y >= boxHeight) { // 上边放的下
						posY = y - boxHeight - 1
					}
					return [posX, posY]
				}
			},
			/**
			 * tooltip格式化
			 * @param {Object} unit 数值后的单位
			 * @param {Object} formatFloat2 是否保留两位小数
			 * @param {Object} formatThousands 是否添加千分位
			 */
			tooltipFormatter(unit, formatFloat2, formatThousands) {
				return params => {
					let result = ''
					unit = unit ? unit : ''
					for (let i in params) {
						if (i == 0) {
							result += params[i].axisValueLabel
						}
						let value = '--'
						if (params[i].data !== null) {
							value = params[i].data
							// 保留两位小数
							if (formatFloat2) {
								value = this.formatFloat2(value)
							}
							// 添加千分位
							if (formatThousands) {
								value = this.formatThousands(value)
							}
						}
						// #ifdef H5
						result += '' + params[i].seriesName + ':' + value + '' + unit
						// #endif

						// #ifdef APP-PLUS
						result += '<br/>' + params[i].marker + params[i].seriesName + ':' + value + ' ' + unit
						// #endif
					}
					return result
				}
			},
			// 设置兼容App的legendFormatter
			legendFormatter() {
				let seriesData = optionData.series[0].data
				let total = 0;
				seriesData.forEach(v => total += Number(v.value))

				function countPercent(name) {
					let numPer = ''
					let num = 0
					seriesData.forEach(v => {
						if (v.name === name) {
							num = Number(v.value)
							numPer = Number(v.value) <= 0 ? "0%" :
								`${Math.round((Number(v.value)/total) * 10000)/100.0}%`
						}
					})
					return {
						numPer,
						num
					}
				}
				return name => {
					return `{name|${name}}  {value|${countPercent(name).num}个${countPercent(name).numPer}}`
				}
			},
			/**
			 * 保留两位小数
			 * @param {Object} value
			 */
			formatFloat2(value) {
				let temp = Math.round(parseFloat(value) * 100) / 100
				let xsd = temp.toString().split('.')
				if (xsd.length === 1) {
					temp = (isNaN(temp) ? '0' : temp.toString()) + '.00'
					return temp
				}
				if (xsd.length > 1) {
					if (xsd[1].length < 2) {
						temp = temp.toString() + '0'
					}
					return temp
				}
			},
			/**
			 * 添加千分位
			 * @param {Object} value
			 */
			formatThousands(value) {
				if (value === undefined || value === null) {
					value = ''
				}
				if (!isNaN(value)) {
					value = value + ''
				}
				let re = /\d{1,3}(?=(\d{3})+$)/g
				let n1 = value.replace(/^(\d+)((\.\d+)?)$/, function(s, s1, s2) {
					return s1.replace(re, '$&,') + s2
				})
				return n1
			}
		}
	}
</script>

<style lang="scss" scoped>
	.echarts {
		width: 100%;
		height: 100%;
	}
</style>
三. 在页面使用echarts组件
<template>
	<view>
		<echarts class="echarts" :option="echartsOption" style="height: 800rpx;"></echarts>
	</view>
</template>

<script>
	export default {
		data() {
			return {
				echartsOption: {
					notMerge: true, // 自定义变量:true代表不合并数据,比如从折线图变为柱形图则需设置为true;false或不写代表合并
					tooltip: {
						trigger: 'axis',
						positionStatus: true,
						formatterStatus: false, // 自定义变量:是否格式化tooltip,设置为false时下面三项均不起作用
						formatterUnit: '元', // 自定义变量:数值后面的单位
						formatFloat2: true, // 自定义变量:是否格式化为两位小数
						formatThousands: true // 自定义变量:是否添加千分位
					},
				},
			}
		},
     	mounted() {
			this.initEcharts()
		},
		methods: {
			async initEcharts() {
				let seriesData = [
					["18", "19", "20", "21", "22", "23", "24", "25", "26", "27", "28"],
					[5, 8, 19, 44, 56, 22, 34, 88, 43, 55, 67],
					[6, 4, 66, 35, 64, 67, 12, 54, 87, 52, 60],
				]
				let series = [{
						"name": "总闸",
						"type": "line",
						"seriesLayoutBy": "row"
					},
					{
						"name": "回路1",
						"type": "line",
						"seriesLayoutBy": "row"
					},
				]

				let option = {
					legend: {
						// 开启图例点击交互
						selectedMode: true,
						data: series,
						right: 0,
					},
					tooltip: {
						trigger: "axis",
						axisPointer: {
							type: "cross",
							label: {
								backgroundColor: "#6a7985",
							},
						},
					},
					grid: {
						top: 100
					},
					dataset: {
						source: seriesData
					},
					xAxis: {
						type: 'category',
						boundaryGap: false,
						name: "",
						nameLocation: 'middle', //轴位置
						nameGap: 26, //name名字与轴线间距
					},
					yAxis: {
						gridIndex: 0,
						// 整条y轴
						axisLine: {
							show: true
						},

					},
					series: series
				};

				this.echartsOption = {
					...this.echartsOption,
					...option,
				}
			},

		},

	}
</script>


<style lang="scss" scoped>
</style>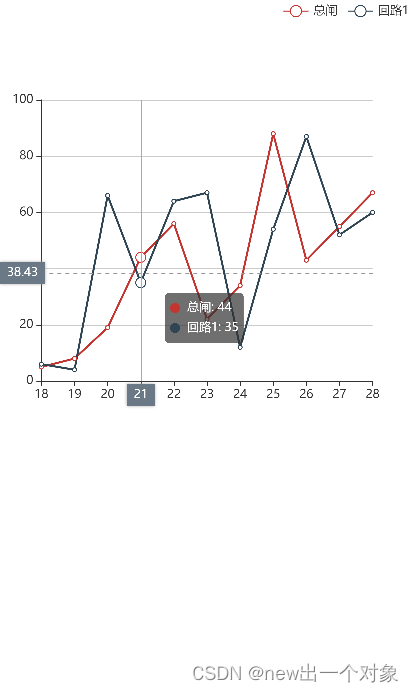
更多推荐


 3
3 0
0- 0


 已为社区贡献12条内容

所有评论(0)