
vue中使用echarts及报错(Cannot read property ‘init‘ of undefined)处理
·
安装步骤
项目控制台输入npm install echarts --save
找到main.js 引入
import * as echarts from 'echarts'
Vue.prototype.$echarts = echarts然后就可以按照官网文档里的5分钟上手内容使用了
这里给个简单例子 官网上扒的示例图表
<template>
	<div class="home">
	  <div id="echarts" style="width:600px;height:400px";>
	  </div>
	</div>
</template>

<script>
	export default {
		name: 'Home',
		data() {
			return {

			};
		},
		methods: {
			drawLine() {
				// 基于准备好的dom,初始化echarts实例
				let myChart = this.$echarts.init(document.getElementById('echarts'))
				// 绘制图表
				myChart.setOption({
					title: {
						text: '表头'
					},
					// darkMode:'true',
					tooltip: {
						trigger: 'axis',
						axisPointer: {
							type: 'cross',
							label: {
								backgroundColor: '#6a7985'
							}
						}
					},
					legend: {
						data: ['邮件营销', '联盟广告', '视频广告', '直接访问', '搜索引擎']
					},
					toolbox: {
						feature: {
							saveAsImage: {}
						}
					},
					grid: {
						left: '3%',
						right: '4%',
						bottom: '3%',
						containLabel: true
					},
					xAxis: [{
						type: 'category',
						boundaryGap: false,
						data: ['周一', '周二', '周三', '周四', '周五', '周六', '周日']
					}],
					yAxis: [{
						type: 'value'
					}],
					series: [{
							name: '邮件营销',
							type: 'line',
							stack: '总量',
							areaStyle: {},
							emphasis: {
								focus: 'series'
							},
							data: [120, 132, 101, 134, 90, 230, 210]
						},
						{
							name: '联盟广告',
							type: 'line',
							stack: '总量',
							areaStyle: {},
							emphasis: {
								focus: 'series'
							},
							data: [220, 182, 191, 234, 290, 330, 310]
						},
						{
							name: '视频广告',
							type: 'line',
							stack: '总量',
							areaStyle: {},
							emphasis: {
								focus: 'series'
							},
							data: [150, 232, 201, 154, 190, 330, 410]
						},
						{
							name: '直接访问',
							type: 'line',
							stack: '总量',
							areaStyle: {},
							emphasis: {
								focus: 'series'
							},
							data: [320, 332, 301, 334, 390, 330, 320]
						},
						{
							name: '搜索引擎',
							type: 'line',
							stack: '总量',
							label: {
								show: true,
								position: 'top'
							},
							areaStyle: {},
							emphasis: {
								focus: 'series'
							},
							data: [820, 932, 901, 934, 1290, 1330, 1320]
						}
					]
				});
			}
		},
		mounted() {
			this.drawLine()
		}
	}
</script>
<style scoped="scoped">
	.home {
		height: 100%;
		width: 100%;
	}
</style>
报错处理
如果出现了以下报错
TypeError: Cannot read property 'init' of undefined
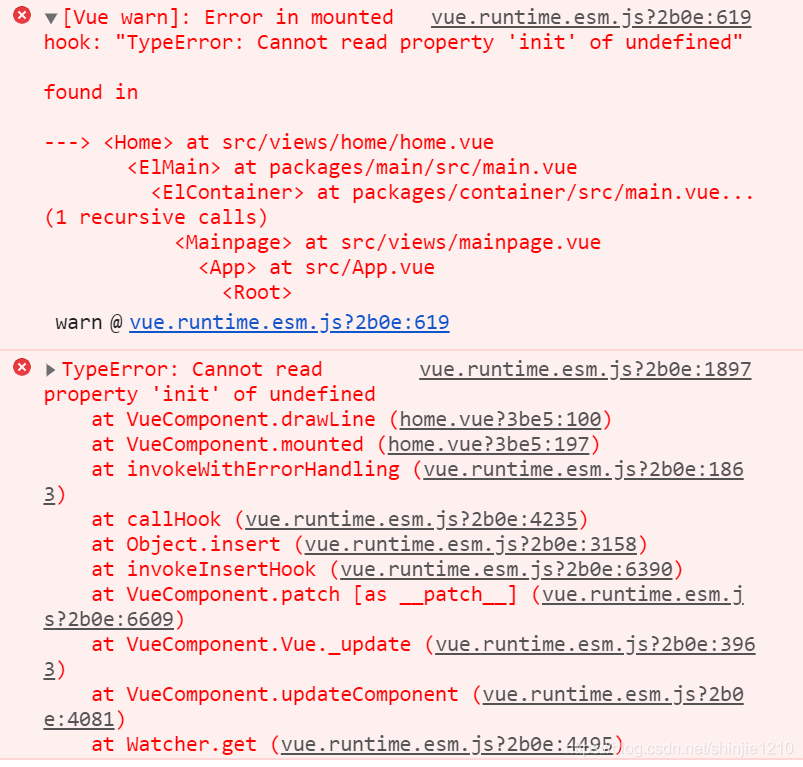
一般是在main.js里引入时直接写了以下代码导致的,按本文一开始的引入修改就行了
import echarts from 'echarts'更多推荐



 0
0 0
0- 0


 已为社区贡献1条内容

所有评论(0)