
【跟我学oracle18c】第五十四天:3.3-3.6 ADDM报告及AWR快照(每个问题的发现都是通过估计性能问题导致的DB时间来量化的)
这句比较经典:
“每个问题的发现都是通过估计性能问题导致的DB时间来量化的”
3.3 Reviewing the Automatic Database Diagnostic Monitor Analysis
默认情况下,ADDM每小时运行一次,以分析AWR在此期间拍摄的快照。如果数据库发现性能问题,那么它将在数据库主页的Summary部分显示诊断下的分析结果。
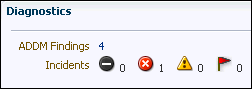
Description of the illustration diagnostic_sum.gif
ADDM结果链接显示在最近的ADDM分析中发现了多少ADDM结果。
查看ADDM调查结果:
-
Access the Database Home page.
See "Accessing the Database Home Page" for more information.
-
-
从“性能”菜单中选择“advisor Home”。
如果出现数据库登录页面,则以具有管理员权限的用户登录。出现Advisor Central页面。
在Advisor Tasks的Results部分,选择最近的ADDM结果,然后单击View result。
将出现自动数据库诊断监视器(ADDM)页面。将显示ADDM运行的结果。
图3-1自动数据库诊断监视器页面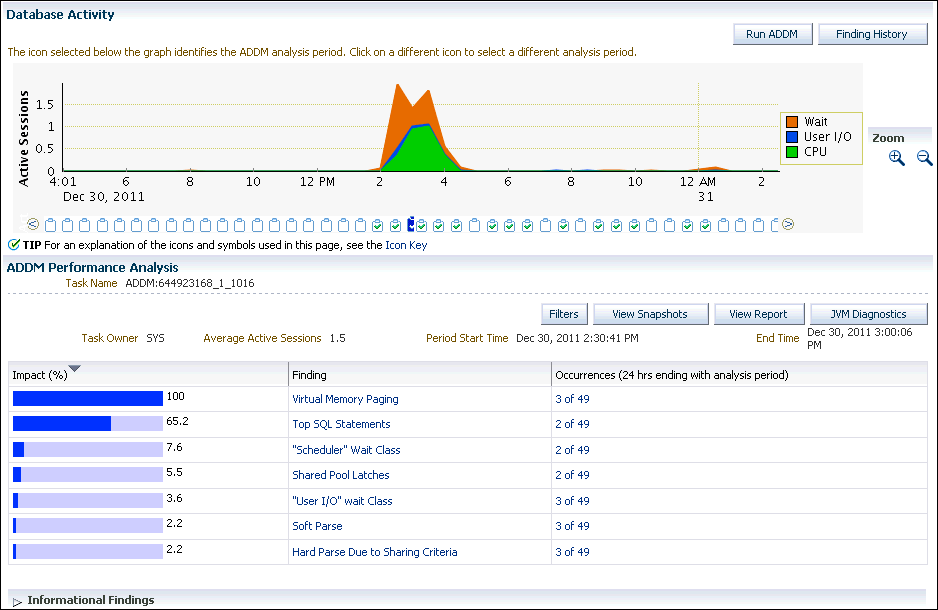
Description of "Figure 3-1 The Automatic Database Diagnostic Monitor Page"在自动数据库诊断监视器(ADDM)页面上,数据库活动图显示了ADDM分析期间的数据库活动。数据库活动类型在图例中根据它们在图表中对应的颜色定义。图表下面的每个图标代表不同的ADDM任务,而ADDM任务又对应于保存在AWR中的一对快照。
在图3-1中,数据库活动部分的叠加区域图显示,12月30日下午2:00 - 4:30是数据库活动最多的时段。在此期间,活动由CPU和wait类控制,很少发生I/O。
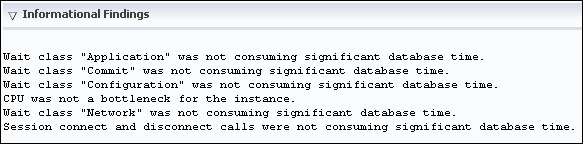
在ADDM性能分析部分,ADDM结果按降序列出,从影响最大到影响最小。信息调查结果部分列出了对性能没有影响的领域,这些领域仅供参考。
-
Optionally, click the Zoom icons to shorten or lengthen the analysis period displayed on the chart.
-
To view the ADDM findings in a report, click View Report.
The View Report page appears.
You can click Save to File to save the report for later access.
3.4 解释自动数据库诊断监视器的发现
ADDM分析结果表示为一组结果。每个ADDM发现属于以下三种类型之一:
-
问题
描述数据库性能问题的根本原因的发现
症状
包含经常导致一个或多个问题发现的信息的发现
信息
用于报告系统中对性能没有影响的区域的结果
每个问题的发现都是通过估计性能问题导致的DB时间来量化的。
当一个特定问题有多个原因时,ADDM可能报告多个结果。在这种情况下,这些多个结果的影响可能包含相同的DB时间。因为性能问题可能会重叠,所以将报告结果的影响加起来可以得到一个高于100% DB时间的数字。例如,如果一个系统执行许多读I/O操作,ADDM可能会报告一条SQL语句,该语句占数据库时间的50%,这是由于I/O活动,作为一个发现,而一个大小不足的缓冲区缓存占数据库时间的75%作为另一个发现。
问题发现可以与减少性能问题影响的建议列表相关联。每个建议都有一个优点,即如果实现了建议,可以节省的DB时间。当多个建议与ADDM发现相关联时,这些建议可能包含解决相同问题的替代方案。在这种情况下,好处的总和可能比发现的影响要大。您不需要应用所有建议来解决相同的问题。
建议由行动和原理组成。您必须应用建议的所有操作来获得其估计的收益。这些原理解释了为什么推荐这组操作,并为实现它们提供了额外的信息。ADDM操作可以提供多个解决方案。如果是这样,那么选择最容易实现的解决方案。
3.5 实现自动数据库诊断监视器建议
本节描述如何实现ADDM建议。ADDM结果显示在ADDM性能分析下的自动数据库诊断监视器(ADDM)页面中。
执行ADDM建议:
-
Access the Database Home page.
See "Accessing the Database Home Page" for more information.
-
From the Performance menu, select Advisors Home.
If the Database Login page appears, then log in as a user with administrator privileges. The Advisor Central page appears.
-
In the Results section of Advisor Tasks, select the most recent ADDM result, then click View Result.
The Automatic Database Diagnostic Monitor (ADDM) page appears.
-
In the Database Activity section, click the chart icon for the ADDM run to investigate.
The data in the ADDM Performance Analysis section changes based on the ADDM run that you selected.
-
在ADDM性能分析表中,单击影响最大的ADDM发现。
在下面ADDM性能分析表的屏幕截图中,影响最大的是Top SQL语句。
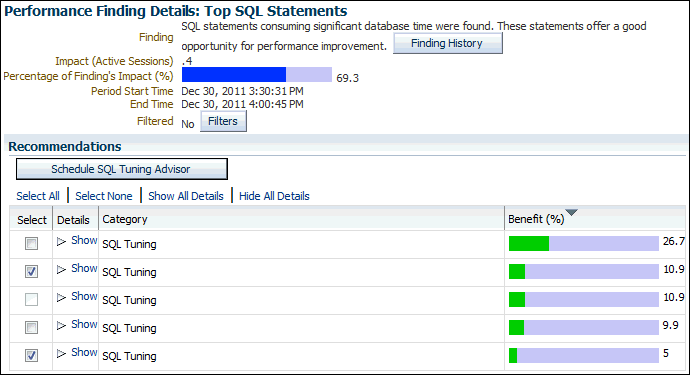
Description of the illustration perf_analysis.gif出现性能查找详细信息页面。
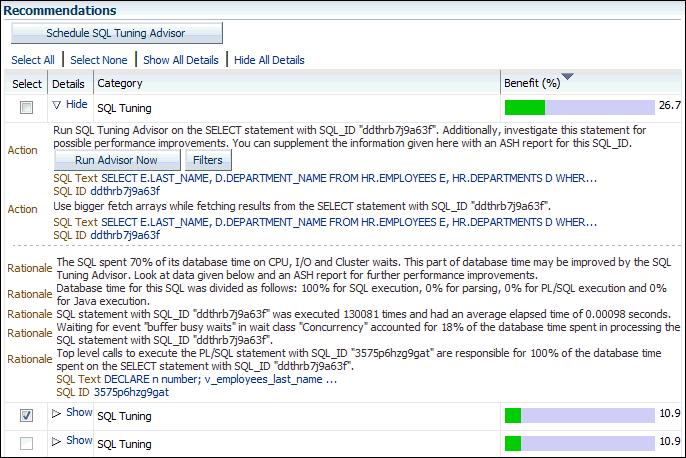
在下面的性能查找详细信息页面的屏幕快照中,将显示五个建议。据估计,第一种方法在分析期间的最大收益可达数据库时间的26.7%。据估计,第二个建议的最大好处是DB时间的10.9%,第三个建议的最大好处也是10.9%,第四个建议的最大好处是9.9%,第五个建议的最大好处是5%。 -
在“建议”下,单击“显示”查看每个建议的建议和所需的操作。
类别列显示推荐的类别。利(%)列显示实现建议的估计好处。Figure 3-2 shows the recommendations for the first item in the Recommendations table.
Figure 3-2 Recommendations on the Performance Finding Details Page
Description of "Figure 3-2 Recommendations on the Performance Finding Details Page" -
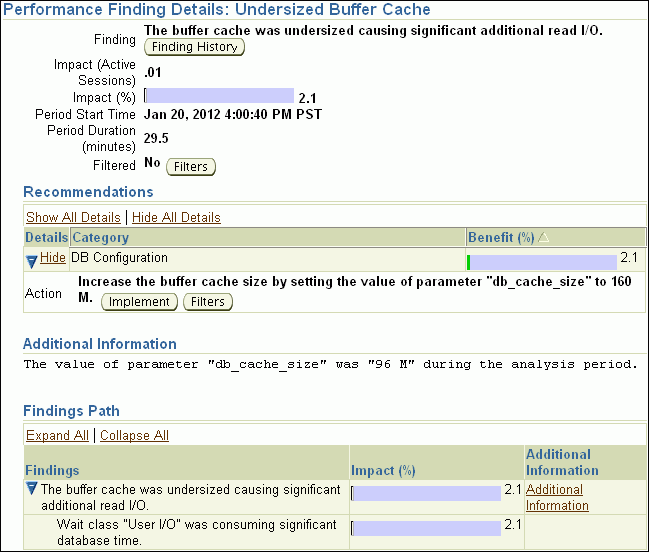
如果有关于为什么推荐操作集的附加信息,那么单击附加信息,或者查看附加信息下显示的内容。
例如,下面的屏幕截图显示了一个大小过小的缓冲区缓存查找结果,其中包含指示db_cache_sizeinitialize参数推荐值的附加信息。 -
To view the history of a finding, click Finding History.
The Finding History page appears. The following screenshot shows the Finding History page for the top SQL statements.
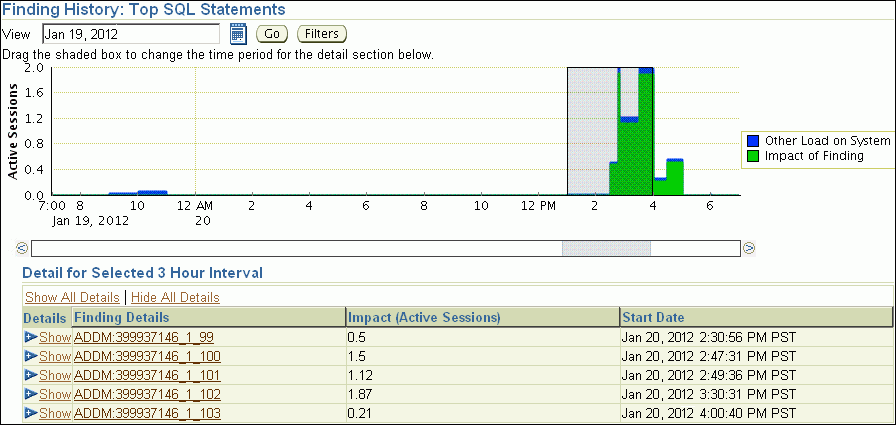
Description of the illustration finding_history.gif查找历史页面显示在选定的3小时间隔内发生特定查找的频率。您可以使用此信息来确定该发现是系统中的暂时问题还是持久问题。根据这些信息,您可以确定是否应该实现与该发现相关的操作。
活动会话堆栈区域图显示了搜索结果和其他负载对系统的影响。您可以按如下方式更改显示器:-
若要移动3小时间隔,请单击并拖动活动会话图表中的阴影框。
要更改日期,请在视图字段中输入所需日期,然后单击Go。
要查看有关查找的详细信息,请单击“查找详细信息”列中的链接,以显示对应ADDM查找的性能查找详细信息页面。
-
-
可选地,创建一个过滤器来抑制已知的已调优或无法进一步调优的结果。要为选定的ADDM查找创建筛选器:
-
Click Filters.
The Filters for Finding page appears.
-
Click Create.
The Create Filter for Finding page appears.
-
In the Name field, enter a name for the ADDM filter.
-
In the Active Sessions field, specify the filter criteria in terms of the number of active sessions.
The database filters the ADDM finding for future ADDM runs if the number of active sessions for the finding is less than the specified filter criteria.
-
In the % Active Sessions field, specify the filter criteria in terms of percentage of active sessions.
The database filters the ADDM finding for future ADDM runs if the number of active sessions for the finding is less than the specified filter criteria.
-
Click OK.
-
-
Perform the required action of a chosen recommendation.
-
执行所选建议的所需操作。
See Also:
根据您选择执行的操作类型,可能有各种选项可用,例如implementation或Run Advisor Now。这些选项使您能够通过单击鼠标立即实现推荐。
在图3-2所示的示例中,最简单的解决方案是单击Run Advisor Now,立即在SQL语句上运行SQL调优顾问任务。
3.6 查看快照数据
您可以使用云控制查看AWR拍摄的快照中包含的数据。通常,没有必要检查快照数据,因为它主要包含原始统计信息。相反,要依赖ADDM,它分析统计数据以识别性能问题。快照统计信息主要针对高级用户,例如习惯于使用Statspack进行性能分析的dba。
查看快照统计信息:
-
Access the Database Home page.
See "Accessing the Database Home Page" for more information.
-
From the Performance menu, select AWR and then select AWR Administration.
If the Database Login page appears, then log in as a user with administrator privileges. The Performance page appears.
-
Under Manage Snapshots and Baselines, click the number next to Snapshots.
The Snapshots page appears with a list of the most recent snapshots.
-
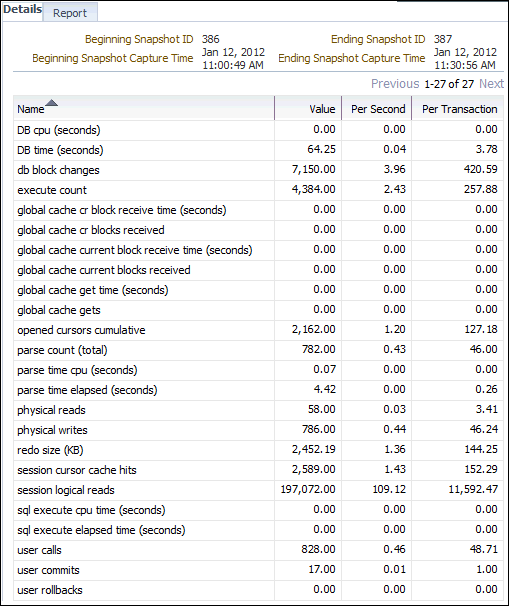
To view the statistics gathered in a snapshot, click the ID link of the snapshot you want to view.
The Snapshot Details appears, showing the Details subpage.
The following screenshot of a Details subpage shows statistics gathered from the previous snapshot (snapshot 386) to the selected snapshot (snapshot 387).
-
To view a Workload Repository report of the statistics, click Report.
The Workload Repository report appears.
-
Optionally, click Save to File to save the report for later access.
See Also:
更多推荐
 0
0 0
0- 0


 已为社区贡献5条内容

所有评论(0)