
Jmeter+influxdb+grafanawin10环境下搭建
Jmeter+influxdb+grafanawin10环境下搭建
前言
响应号召,搭建一下测试环境,因为是纯小白一个,Linux也不熟悉,索性直接将环境搭在本机上练练手。因为中途遇见了好多坑,所以想给自己记录一下,也希望其他人避免踩坑。
下载
主要说说influxdb和grafana,基本都是免安装的软件,只需要解压一下就好,就只列一下网址吧。
influxdb链接:
grafana链接:
Chronograf链接
下载influxdb时,如果点击下载无响应,可以查看源码直接找对应的下载链接。
influxdb配置
1.解压
修改influxdb.conf配置文件,建议使用notepade++修改
2.配置influxdb.conf文件
2.1修改26行地址,去掉29,32行注释,路径修改与第二步一致
[meta]
  # Where the metadata/raft database is stored
  dir = "D:\\influxdb\\influxdb\\meta"

  # Automatically create a default retention policy when creating a database.
  # retention-autocreate = true

  # If log messages are printed for the meta service
    logging-enabled = true
2.2修改45、48行地址,路径也为对应解压路径
[data]
  # The directory where the TSM storage engine stores TSM files.
  dir = "D:\\influxdb\\influxdb\\data"

  # The directory where the TSM storage engine stores WAL files.
  wal-dir = "D:\\influxdb\\influxdb\\wal"
2.3去掉68;168、171;183,186、190;203、206、209;220、223;行注释
  # Whether queries should be logged before execution. Very useful for troubleshooting, but will
  # log any sensitive data contained within a query.
    query-log-enabled = true
[retention]
  # Determines whether retention policy enforcement enabled.
    enabled = true

  # The interval of time when retention policy enforcement checks run.
    check-interval = "30m"
[shard-precreation]
  # Determines whether shard pre-creation service is enabled.
    enabled = true
  # The interval of time when the check to pre-create new shards runs.
    check-interval = "10m"
  # The default period ahead of the endtime of a shard group that its successor
  # group is created.
    advance-period = "30m"
[monitor]
  # Whether to record statistics internally.
    store-enabled = true

  # The destination database for recorded statistics
    store-database = "_internal"

  # The interval at which to record statistics
    store-interval = "10s"
[http]
  # Determines whether HTTP endpoint is enabled.
    enabled = true

  # The bind address used by the HTTP service.
    bind-address = ":8086"
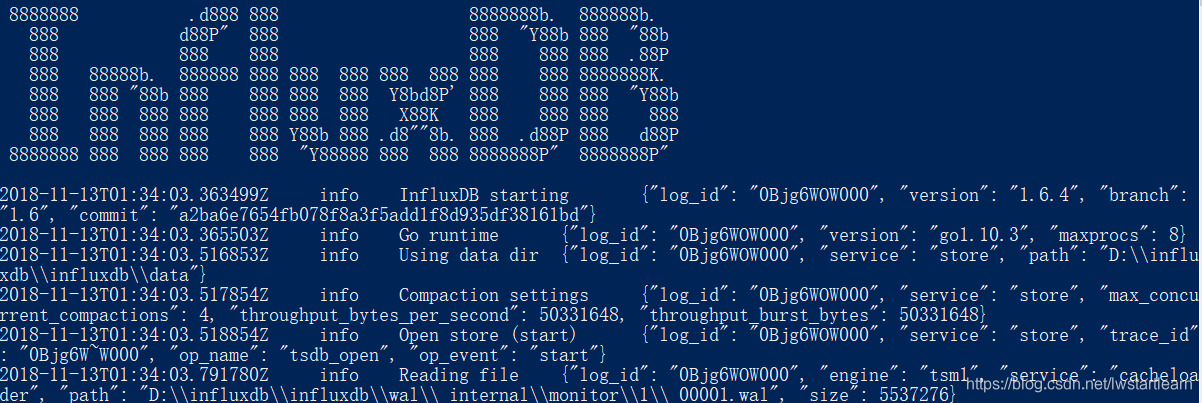
3.如果使用PowerShell,使用 .\influxd.exe -config .\influxdb.conf命令
如果使用cmd,切换到对应路径下,使用influxd.exe -config influxdb.conf命令
预期结果如下:
4.运行influx.exe
新建一个数据库,以备配置grafana数据源时使用
create database test
使用某个表
use test
展示所有表
show measurements
chronograf使用
当然也可以使用web端管理,需要下载Chronograf 组件作为web管理端,前提要开启influx数据库
1、解压文件后,直接进入安装目录,执行chronograf.exe后;
2、输入:http://localhost:8888(chronograf默认是8888端口)
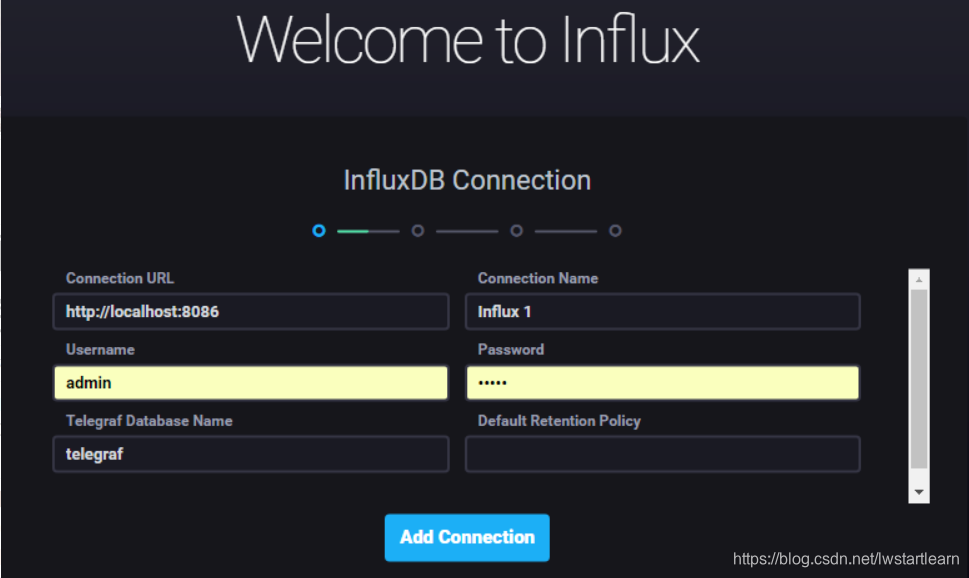
3、influxDB数据源连接
Grafana配置
1.解压文件后,进入安装目录,直接执行grafana-server.exe,然后最小化
2、打开浏览器,在地址栏输入:http://localhost:3000,默认账号和用户名为admin/admin,在/etc/grafana/grafana.ini配置文件中可修改
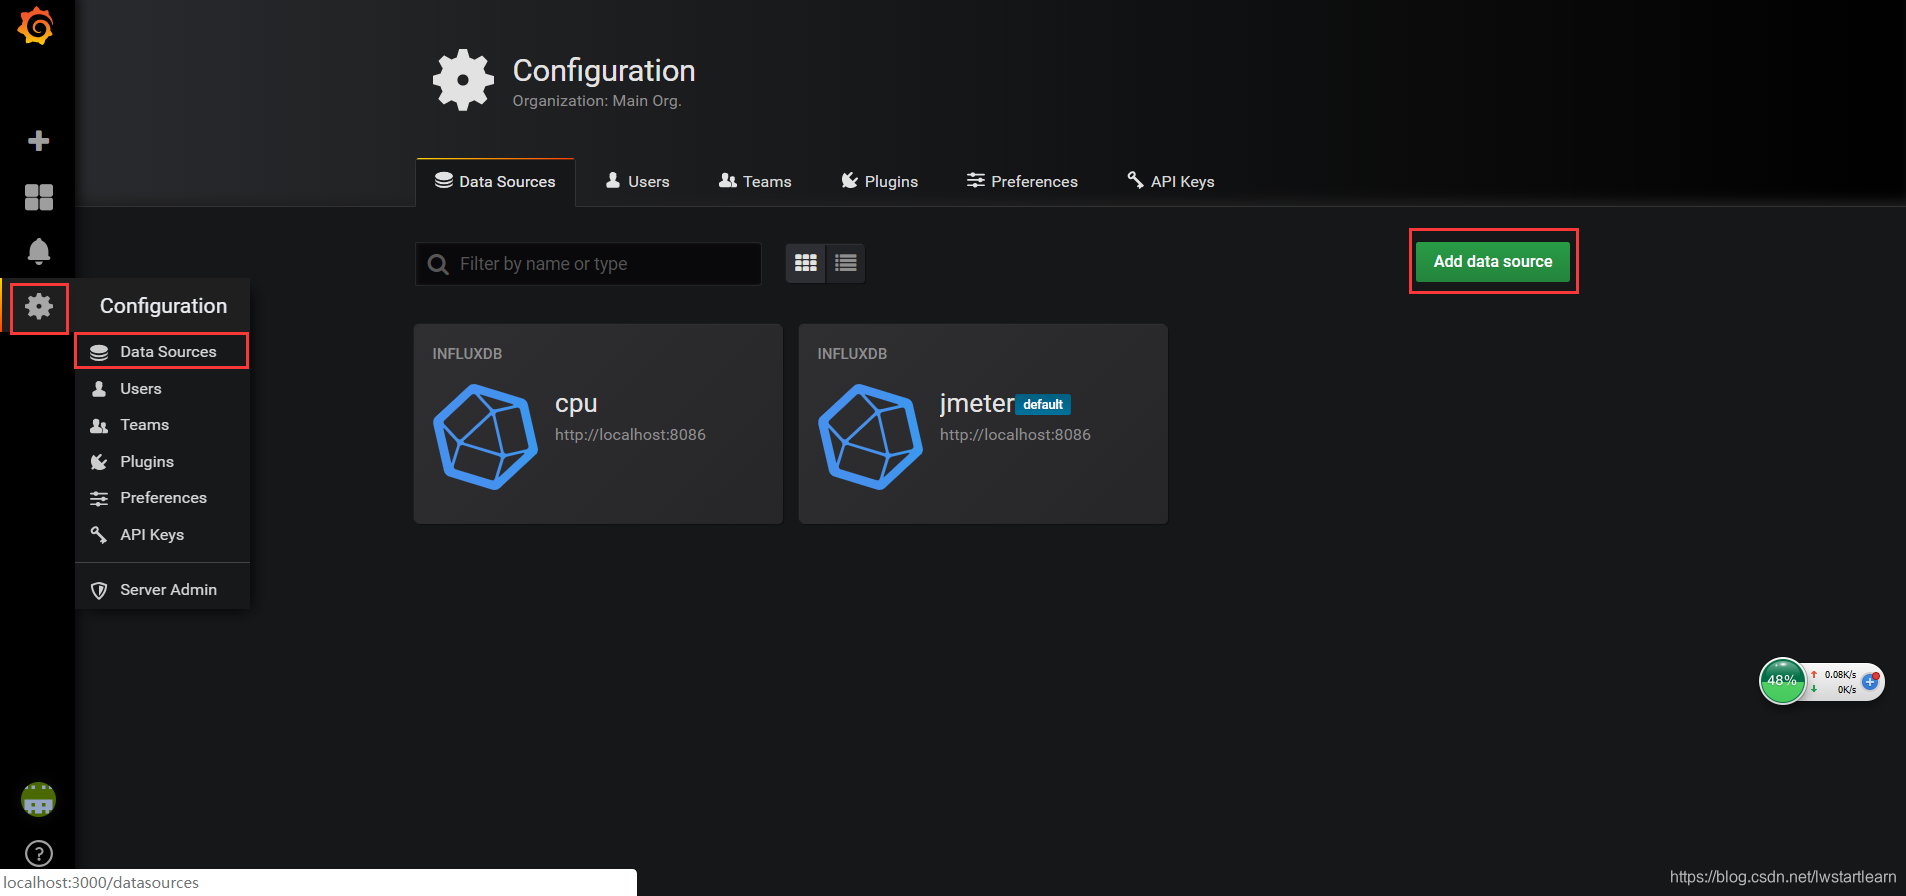
3、influxDB数据源连接
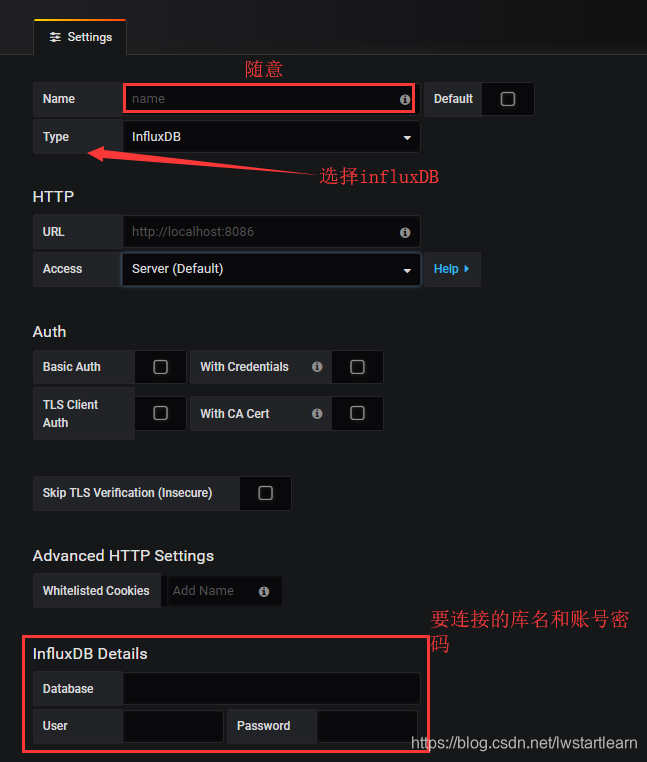 配置完成就可以保存
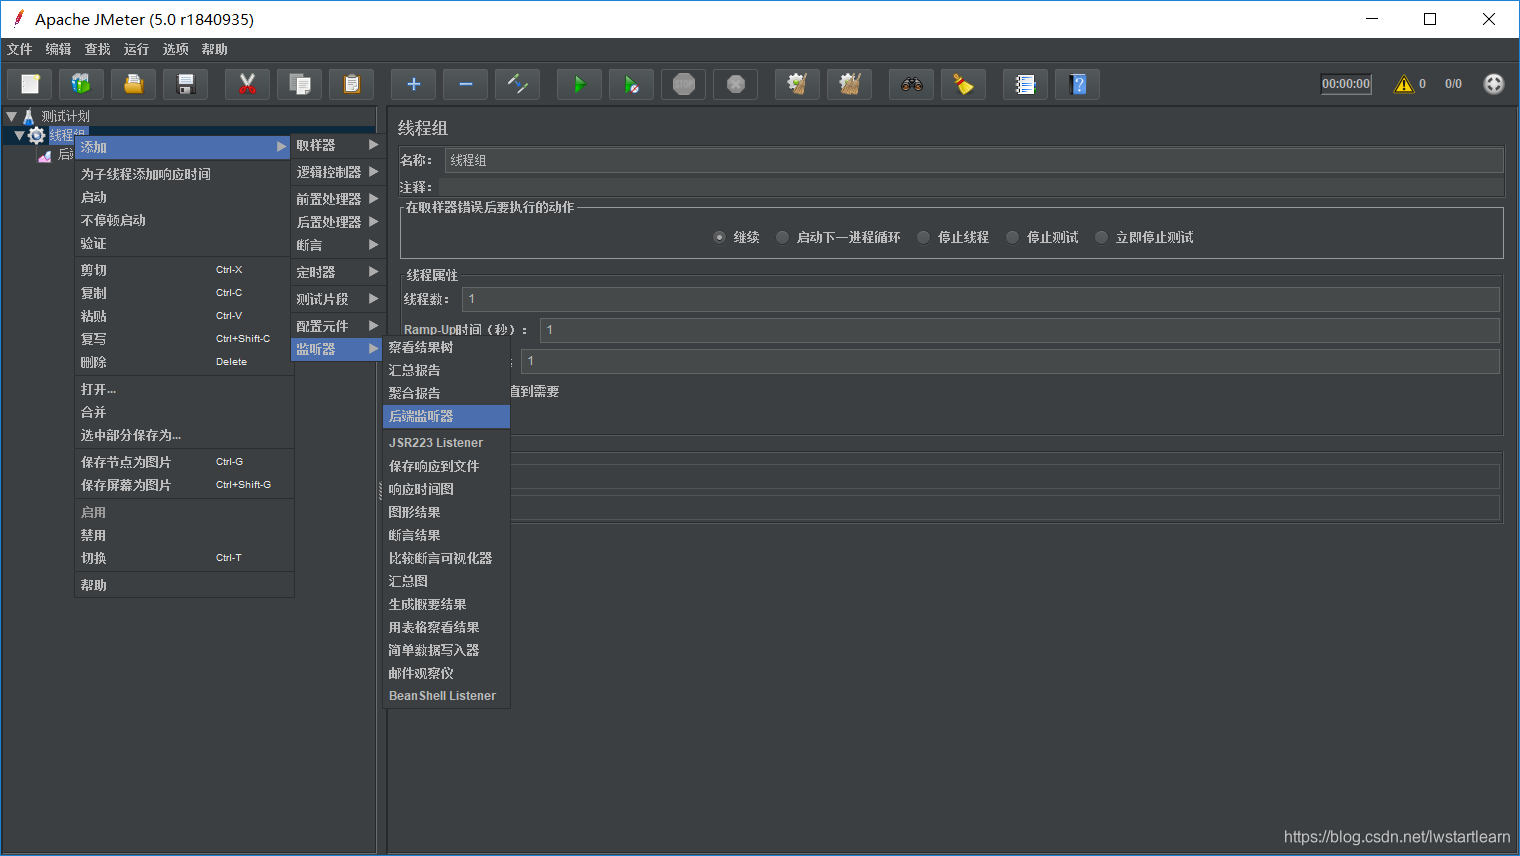
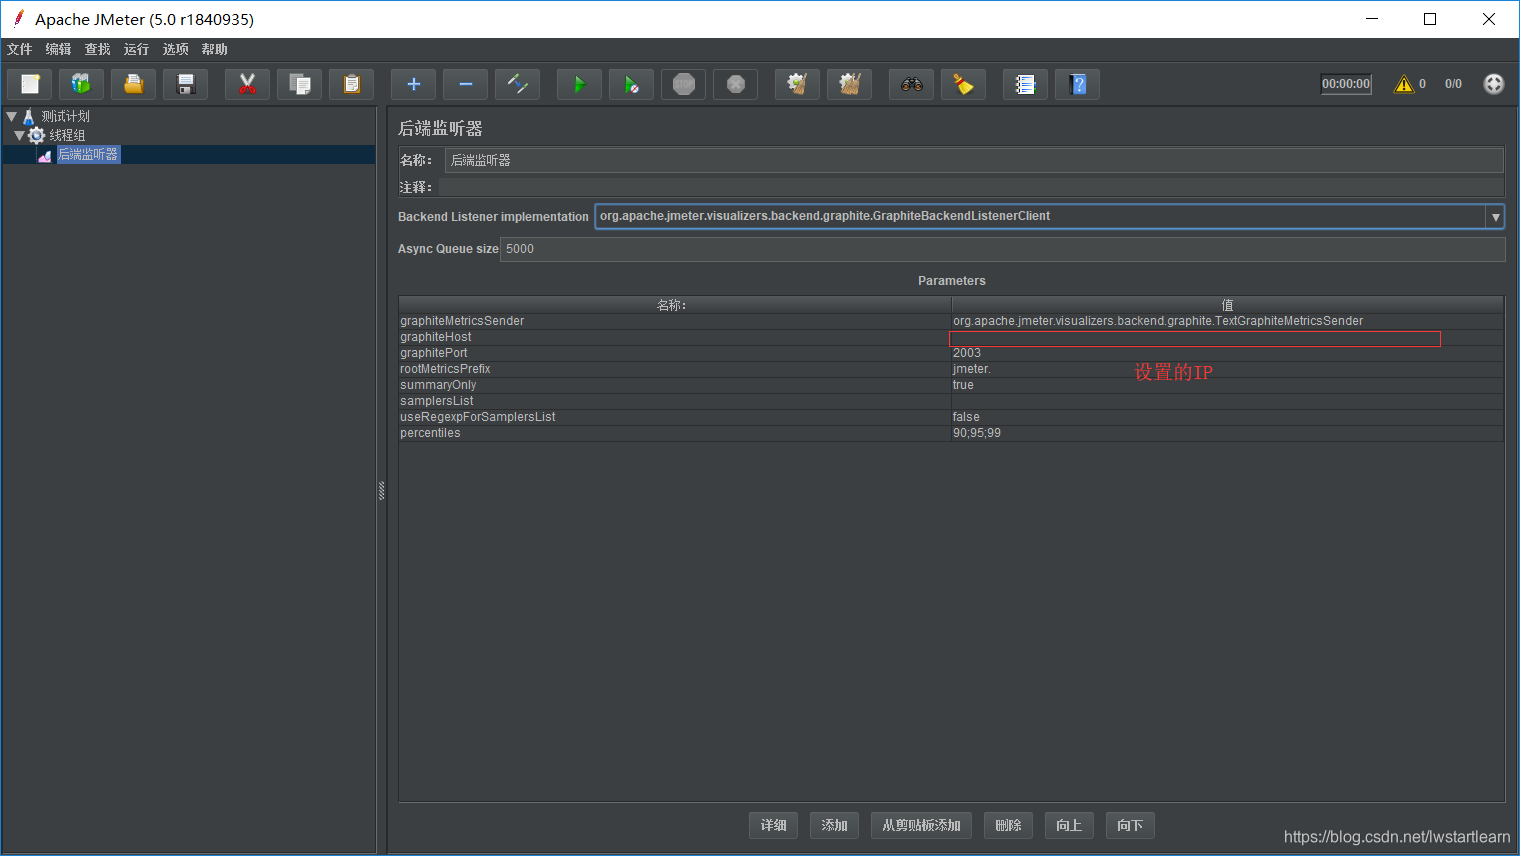
Jmeter配置后端监听器
感谢
配置过程也是参考了好多的文章,大体列几个链接吧,看的太多也记不全了
https://blog.csdn.net/SwTesting/article/details/82700023?utm_source=blogxgwz9
https://blog.csdn.net/hxpjava1/article/details/79442070
https://www.jianshu.com/p/f59fea803879
更多推荐



 0
0 0
0- 0


 已为社区贡献1条内容

所有评论(0)