
Java通过POI或Freemarker生成word文档,使用Jfreechart创建统计图表
最近做了一个使用Java生成统计分析报告word文档的功能,有提前制作好的word文档,其中共包含了普通文本变量,普通表格,动态表格、统计图表(柱状图、饼状图、折线图等),在此记录下POI和freemarker两种方法。
POI:
POI是使用.docx文件作为模板的,直接将word文档中需要替换的数据改为${变量名},然后通过加载模板并解析为document对象来处理,也可以直接创建一个空的dcoument对象,document通常通过段落(XWPFParagraph)、表格(XWPFTable)、和图片(XWPFPictureData)来解析整个文档。(注意:这里的段落是当格式发生变化时就是一个新的段落,而不是文档中文本的段落)
一个word文档包含多个段落,一个段落包含多个Runs,一个Runs包含多个Run,Run是文档的最小单位
获取所有段落:List<XWPFParagraph> paragraphs = document.getParagraphs();
获取一个段落中的所有Runs:List<XWPFRun> runs = paragraph.get(0).getRuns();
获取一个Runs中的一个Run:XWPFRun run = runs.get(index);
一个word文档可包含多个表格,每个表格可以包含多行,每行可以包含多列(格)。注意:每一个单元格又相当于一个完整的文档,包含了XWPFParagraph、XWPFRun
获取所有表格:List<XWPFTable> xwpfTables = doc.getTables();
获取一个表格中的所有行:List<XWPFTableRow> xwpfTableRows = xwpfTable.getRows();
获取一行中的所有列:List<XWPFTableCell> xwpfTableCells = xwpfTableRow.getTableCells();
获取一格里的内容:List<XWPFParagraph> paragraphs = xwpfTableCell.getParagraphs();
图片是直接获取到一个图片列表xwpfDocument.getAllPictures();
首先解释下XWPFParagraph,普通文本中一个段落就是单行形式,而在表格中一个单元格里也可能会有多个段落XWPFParagraph,多个XWPFRun,所以替换变量值的时候要注意,有时候会出现替换之后,原来的内容还有一部分没替换完。这个多试几次也就会发现了。其次就是POI是要解析整个word文档的,然后将之替换为实际值,因此会有大量编码。但是这样也会对文档内容、格式调整有较好的支持。
freemarker
freemarker是以.ftl文件为模板,是先将.docx进行变量替换${变量名},然后将.docx文件另存为xml文件,再改为.xml后缀改为.ftl,就得到了.ftl的模板文件,然后使用FreeMarker引擎将数据填充到模板,来动态渲染生成输出文本。(方法大家自行搜索下,很多的案例)
制作模板过程:
将 word 中需要填充的数据用占位符${变量名}替换。
将该 word 另存为 .xml 的格式,并检查看格式是否有误(重点:打开xml文件,查看占位符${变量名}是否完整,如果被分割开了,就复制完整,然后删掉多余的标签)。
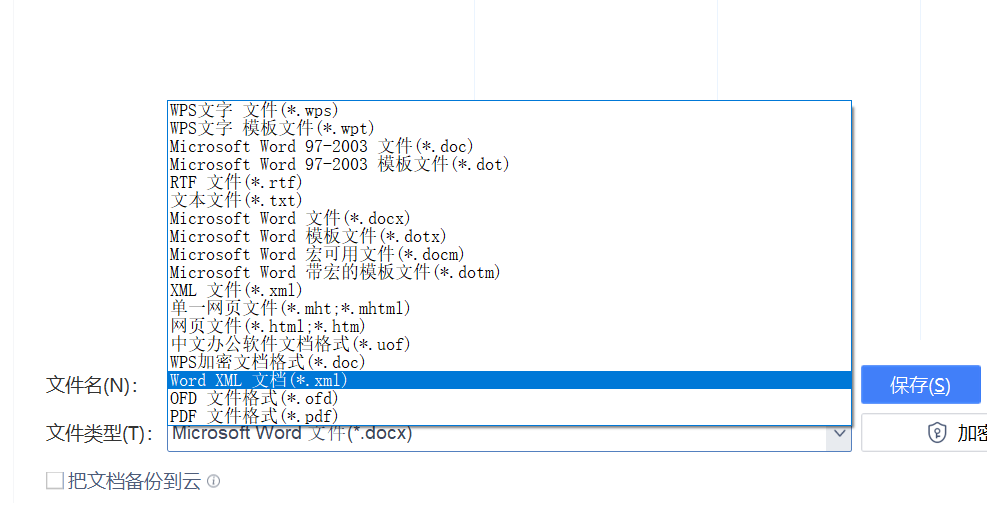
将后缀.xml改成.ftl后,模板就制作完成了。
其中对于表格数据需要单独做处理,可以参考教程https://blog.csdn.net/weixin_45103378/article/details/118395284。
POI实现方式:主要就是要解析出所有的变量,然后进行替换,以下为部分代码片段
public class POIWordUtil {
    /**
     * 替换段落文本
     * @param document docx解析对象
     * @param textMap  需要替换的信息集合
     */
    public static void changeText(XWPFDocument document, Map<String, Object> textMap, Map<String, Object> chartMap) throws IOException {
        //获取段落集合
        List<XWPFParagraph> paragraphs = document.getParagraphs();
        for (XWPFParagraph paragraph : paragraphs) {
            //判断此段落时候需要进行替换
            String text = paragraph.getText();
            if (checkText(text)) {
                List<XWPFRun> runs = paragraph.getRuns();
                for (XWPFRun run : runs) {
                    //判断是否包含$
                    if (!checkText(run.getText(0))) {
                        continue;
                    }

                    //判断是否为chart并替换(这里也是将图表作为变量,然后使用jfreechart生成的图表替换掉)
                    if (isContainsChart(run)) {
                        handleChart(run, chartMap);
                        continue;
                    }

                    //替换文本变量
                    Object obj = matchValue(run.getText(0), textMap);
                    if (obj instanceof String) {
                        run.setText((String) obj, 0);
                    }
                }
            }
        }
    }

    public static void handleTable(XWPFDocument xwpfDocument, Map<String, Object> tableMap) {
        // 获取文档中所有的表格
        List<XWPFTable> tables = xwpfDocument.getTables();
        for (int i = 0; i < tables.size(); i++) {
            XWPFTable table = tables.get(i);
            List<XWPFTableRow> rows = table.getRows();
            // 校验是否需要替换变量
            if (checkText(table.getText())) {
                for (XWPFTableRow row : rows) {
                    List<XWPFTableCell> tableCells = row.getTableCells();
                    for (XWPFTableCell tableCell : tableCells) {
                        if (checkText(tableCell.getText())) {
                            List<XWPFParagraph> paragraphs = tableCell.getParagraphs();
                            for (XWPFParagraph paragraph : paragraphs) {
                                List<XWPFRun> runs = paragraph.getRuns();
                                for (XWPFRun run : runs) {
                                    run.setText(matchValue(tableCell.getText(), tableMap), 0);
                                }
                            }
                        }
                    }
                }
            }
        }
    }

    /**
     * @param text ${...} 带${}的变量text
     * @param map  存储需要替换的数据
     * @return 需要替换的变量值
     * @Description 有${}的值匹配出替换的数据,没有${}就返回原来的数据
     */
    public static String matchValue(String text, Map<String, Object> map) {
        int n = text.length()-text.replaceAll("\\$", "").length();
        for (int i = 0; i < n; i++) {
            String key = text.substring(text.indexOf("$"), text.indexOf("}")+1);
            String key1 = String.valueOf(map.get(key.substring(2, key.indexOf("}"))));
            text = text.replace(key, StringUtils.isEmpty(key1) ? "--" : key1);
        }
        return text;
    }

    public static void handleChart(XWPFRun run, Map<String, Object> chartMap) throws IOException {
        //获取文本的值
        String text = run.getText(0);
        String value = text.substring(text.indexOf("$")+2, text.indexOf("}"));
        Map<String, Object> chartData = (Map<String, Object>) chartMap.get(value);

        // 图表数据为空,不生成图表
        if (null == chartData || CollectionUtils.isEmpty(chartData)) {
            run.setText("暂无数据", 0);
            return;
        }
        // 数据全部为0,则生成图表
        if (isAllZero(chartData)) {
            run.setText("暂无数据", 0);
            return;
        }

        String pictureUrl = "";
        InputStream inputStream = null;
        try {
                // 将此处变量设置为空
                run.setText("", 0);
                // 换行
                run.addBreak();
                if (text.indexOf("VerticalBarChart") != -1) {
                    // 纵向柱状图
                    // 使用jfreechart生成图表,并保存为图片,返回图片的path
                    pictureUrl = JfreeUtil.createBarChart("", chartData, "", "", PlotOrientation.VERTICAL, 700 ,400);
                    inputStream=new FileInputStream(pictureUrl);
                    // 添加图片
                    run.addPicture(inputStream, XWPFDocument.PICTURE_TYPE_PNG, "", Units.toEMU(400), Units.toEMU(250));
                } else if (text.indexOf("HorizontalBarChart") != -1) {
                    // 横向柱状图
                    pictureUrl = JfreeUtil.createBarChart("", chartData, "", "", PlotOrientation.HORIZONTAL, 700 ,400);
                    inputStream=new FileInputStream(pictureUrl);
                    run.addPicture(inputStream, XWPFDocument.PICTURE_TYPE_PNG, "", Units.toEMU(400), Units.toEMU(250));
                } else if (text.indexOf("PieChart") != -1) {
                    // 饼图
                    Map<String, Double> doubleMap = new LinkedHashMap<>();
                    chartData.forEach((k,v) -> doubleMap.put(k, Double.valueOf(v.toString())));
                    pictureUrl = JfreeUtil.createPieChart("", doubleMap, 600, 500);
                    inputStream=new FileInputStream(pictureUrl);
                    run.addPicture(inputStream, XWPFDocument.PICTURE_TYPE_PNG, "", Units.toEMU(360), Units.toEMU(300));
                } else if (text.indexOf("LineChart") != -1) {
                    // 折线图
                    pictureUrl = JfreeUtil.createLineChart("", chartData, "", "", PlotOrientation.VERTICAL, 800 ,400);
                    inputStream=new FileInputStream(pictureUrl);
                    run.addPicture(inputStream, XWPFDocument.PICTURE_TYPE_PNG, "", Units.toEMU(400), Units.toEMU(200));
                }
        } catch (Exception e) {
            log.error("handle chart fail", e);
            throw new ConsciousException("创建图表失败!");
        } finally {
            if (inputStream != null) {
                inputStream.close();
            }

            File pictureFile = new File(pictureUrl);
            if(pictureFile.exists()){
                pictureFile.delete();
            }
        }
    }
}
/**
* 创建图集图表
*/
public class JfreeUtil {
private static final Font FONT = new Font("宋体", Font.PLAIN, 12);
public static String createPieChart(String title, Map<String, Double> datas, int width, int height) throws IOException {
//根据jfree生成一个本地饼状图
DefaultPieDataset pds = new DefaultPieDataset();
datas.forEach(pds::setValue);
//图标标题、数据集合、是否显示图例标识、是否显示tooltips、是否支持超链接
JFreeChart chart = ChartFactory.createPieChart(title, pds, true, false, false);
chart.getTitle().setFont(FONT);
chart.getLegend().setItemFont(FONT);
//设置抗锯齿
chart.setTextAntiAlias(false);
PiePlot plot = (PiePlot) chart.getPlot();
plot.setStartAngle(90);
plot.setNoDataMessage("暂无数据");
plot.setNoDataMessagePaint(Color.blue); // 设置无数据时的信息显示颜色
//忽略无值的分类
plot.setIgnoreNullValues(true);
plot.setIgnoreZeroValues(true);
plot.setBackgroundAlpha(0f);
//设置标签阴影颜色
plot.setShadowPaint(new Color(255, 255, 255));
//设置标签是否显示在饼块内部,默认时在外部
plot.setSimpleLabels(true);
chart.getLegend().setHorizontalAlignment(HorizontalAlignment.CENTER);//设置水平对齐 左对齐;
chart.getLegend().setMargin(0, 0, 0, 0);//参数是:上,左,下,右. 设置饼图的位置
chart.getLegend().setPadding(0, 0, 20, 0);// 设置饼图下文字的位置
chart.getLegend().setFrame(new BlockBorder(0, 0, 0, 0));// 设置饼图下文字边框的位置
// 图片中显示百分比:自定义方式,{0} 表示选项, {1} 表示数值, {2} 表示所占比例 ,小数点后两位
NumberFormat percentInstance = NumberFormat.getPercentInstance();
percentInstance.setRoundingMode(RoundingMode.HALF_UP);
percentInstance.setMaximumFractionDigits(0);
plot.setLabelGenerator(new StandardPieSectionLabelGenerator("{0},{2}", NumberFormat.getNumberInstance(), percentInstance));
return createFile(chart, width, height);
}
public static String createBarChart(String title, Map<String, Object> datas, String type, String units, PlotOrientation orientation, int width, int height) throws IOException {
//数据集
DefaultCategoryDataset ds = new DefaultCategoryDataset();
Iterator<Map.Entry<String, Object>> iterator = datas.entrySet().iterator();
while (iterator.hasNext()) {
Map.Entry<String, Object> entry = iterator.next();
ds.setValue(NumberUtil.parseDouble(String.valueOf(entry.getValue())), "工单数量", StringUtils.defaultString(entry.getKey(), ""));
}
//创建柱状图,柱状图分水平显示和垂直显示两种
JFreeChart chart = ChartFactory.createBarChart(title, type, units, ds, orientation, false, false, false);
//设置文本抗锯齿,防止乱码
chart.setTextAntiAlias(false);
//得到绘图区
CategoryPlot plot = (CategoryPlot) chart.getPlot();
plot.setNoDataMessage("no data");
//设置柱的透明度
plot.setForegroundAlpha(1.0f);
plot.setOutlineVisible(false);
//获取X轴的对象
CategoryAxis categoryAxis = plot.getDomainAxis();
//坐标轴标尺值是否显示
categoryAxis.setTickLabelsVisible(true);
//坐标轴标尺是否显示
categoryAxis.setTickMarksVisible(false);
categoryAxis.setTickLabelFont(FONT);
categoryAxis.setTickLabelPaint(Color.BLACK);
categoryAxis.setLabelFont(FONT);// X轴标题
//categoryAxis.setCategoryLabelPositionOffset(2);//图表横轴与标签的距离(10像素)
//获取Y轴对象
ValueAxis valueAxis = plot.getRangeAxis();
valueAxis.setTickLabelsVisible(true);
valueAxis.setTickMarksVisible(false);
valueAxis.setUpperMargin(0.15);//设置最高的一个柱与图片顶端的距离(最高柱的20%)
valueAxis.setLowerMargin(0d);
valueAxis.setTickLabelFont(FONT);//Y轴数值
valueAxis.setLabelPaint(Color.BLACK);//字体颜色
valueAxis.setLabelFont(FONT);//Y轴标题
NumberAxis numberAxis = (NumberAxis) plot.getRangeAxis();
//设置Y轴刻度为整数
numberAxis.setStandardTickUnits(NumberAxis.createIntegerTickUnits());
//设置网格横线颜色
plot.setRangeGridlinePaint(Color.gray);
plot.setRangeGridlinesVisible(true);
//图片背景色
plot.setBackgroundPaint(Color.white);
plot.setOutlineVisible(false);
// 设置原点xy轴相交,柱子从横轴开始,否则会有间隙
plot.setAxisOffset(new RectangleInsets(0d, 0d, 0d, 0d));
//设置网格横线大小
plot.setDomainGridlineStroke(new BasicStroke(0.5F));
plot.setRangeGridlineStroke(new BasicStroke(0.5F));
//设置柱状图柱子相关
CategoryPlot categoryPlot = chart.getCategoryPlot();
BarRenderer rendererBar = (BarRenderer) categoryPlot.getRenderer();
//组内柱子间隔为组宽的10%,调整柱子宽度
rendererBar.setItemMargin(0.6);
rendererBar.setMaximumBarWidth(0.07);
rendererBar.setDrawBarOutline(true);
rendererBar.setSeriesOutlinePaint(0, Color.decode("#4F97D5"));
//设置柱的颜色#5B9BE6
rendererBar.setSeriesPaint(0, Color.decode("#4F97D5"));
//设置柱子上显示值
rendererBar.setDefaultItemLabelGenerator(new StandardCategoryItemLabelGenerator());
rendererBar.setDefaultItemLabelFont(FONT);
rendererBar.setDefaultItemLabelsVisible(true);
rendererBar.setDefaultItemLabelPaint(Color.BLACK);
return createFile(chart, width, height);
}
public static String createLineChart(String title, Map<String, Object> datas, String type, String unit, PlotOrientation orientation, int width, int hight) throws IOException {
DefaultCategoryDataset ds = new DefaultCategoryDataset();
Iterator iterator = datas.entrySet().iterator();
while (iterator.hasNext()) {
Map.Entry entry = (Map.Entry) iterator.next();
ds.setValue(NumberUtil.parseDouble(String.valueOf(entry.getValue())), "工单数量", entry.getKey().toString());
}
//创建折线图,折线图分水平显示和垂直显示两种
JFreeChart chart = ChartFactory.createLineChart(title, type, unit, ds, orientation, false, true, true);
//设置文本抗锯齿,防止乱码
chart.setTextAntiAlias(false);
//chart.setBorderVisible(true);
//得到绘图区
CategoryPlot plot = (CategoryPlot) chart.getPlot();
//设置横轴标签项字体
CategoryAxis categoryAxis = plot.getDomainAxis();
categoryAxis.setCategoryLabelPositions(CategoryLabelPositions.UP_45);
categoryAxis.setTickMarksVisible(false);
categoryAxis.setTickLabelsVisible(true);
categoryAxis.setTickLabelFont(new Font("宋体", Font.PLAIN, 12));
categoryAxis.setLabelFont(new Font("宋体", Font.PLAIN, 12));
ValueAxis valueAxis = plot.getRangeAxis();
valueAxis.setTickMarksVisible(false);
valueAxis.setTickLabelsVisible(true);
valueAxis.setTickLabelFont(new Font("宋体", Font.PLAIN, 12));
valueAxis.setLabelFont(new Font("宋体", Font.PLAIN, 12));
NumberAxis numberAxis = (NumberAxis) plot.getRangeAxis();
//设置Y轴刻度跨度
numberAxis.setUpperMargin(0.15);
numberAxis.setLowerMargin(0);
numberAxis.setAutoRangeMinimumSize(5);
// 设置背景透明度
plot.setBackgroundAlpha(0.1f);
plot.setForegroundAlpha(1.0f);
// 设置网格横线颜色
plot.setRangeGridlinePaint(Color.gray);
// 设置网格横线大小
plot.setDomainGridlineStroke(new BasicStroke(0.5F));
plot.setRangeGridlineStroke(new BasicStroke(0.5F));
plot.setBackgroundPaint(Color.white);
plot.setOutlineVisible(false);
// 设置原点xy轴相交,y轴为0时,点在横坐标上,否则不在横坐标上
plot.setAxisOffset(new RectangleInsets(0d, 0d, 0d, 0d));
// 生成折线图上的数字
//绘图区域(红色矩形框的部分)
LineAndShapeRenderer renderer = (LineAndShapeRenderer) plot.getRenderer();
renderer.setDefaultItemLabelGenerator(new StandardCategoryItemLabelGenerator());
//设置图表上的数字可见
renderer.setDefaultItemLabelsVisible(true);
//设置图表上的数字字体
renderer.setDefaultItemLabelFont(new Font("宋体", Font.PLAIN, 12));
// 设置线条是否被显示填充颜色
renderer.setUseFillPaint(true);
renderer.setSeriesStroke(0, new BasicStroke(4.0f));
renderer.setSeriesPaint(0, Color.decode("#4472C4"));
return createFile(chart, width, hight);
}
public static String createFile(JFreeChart chart, int width, int hight) throws IOException {
File templateFile = File.createTempFile("jfreetemp", ".png");
String filePath = templateFile.getParent() + File.separator + templateFile.getName();
try {
if (templateFile.exists()) {
templateFile.delete();
}
ChartUtils.saveChartAsPNG(templateFile, chart, width, hight);
} catch (IOException e) {
log.error("create chart file fail.", e);
throw new ConsciousException("创建图表文件失败!");
}
return filePath;
}
}图表要注意的设置:(个人觉得是比较有用的)
//设置标签是否显示在饼块内部,默认时在外部
plot.setSimpleLabels(true);
//组内柱子间隔为组宽的10%,调整柱子宽度
rendererBar.setItemMargin(0.6);
rendererBar.setMaximumBarWidth(0.07);
// 设置原点xy轴相交,零点与坐标轴重合,
plot.setAxisOffset(new RectangleInsets(0d, 0d, 0d, 0d));
freemarker实现方式,首先获取到模板Template
public class FreeMarkerUtils {

    public static Template getTemplate(String templateName) throws IOException {
        // 设置FreeMarker的版本和编码格式
        Configuration configuration = new Configuration(Configuration.VERSION_2_3_30);
        configuration.setDefaultEncoding("utf-8");
        configuration.setClassicCompatible(true);
        // 设置FreeMarker生成Word文档所需要的模板的路径
        // 此处把模版文件都放在resources下的 templates 中
        configuration.setClassForTemplateLoading(FreeMarkerUtils.class, "/templates");
        configuration.setTemplateLoader(new ClassTemplateLoader(FreeMarkerUtils.class, "/templates"));
        // 设置FreeMarker生成Word文档所需要的模板
        return configuration.getTemplate(templateName, "utf-8");
    }
}
然后填充数据即可
public static void main(String[] args) throws IOException {
        String fileName = "testdemo.docx";
        Map<String, String> dataMap = new HashMap<>();

        Writer out = new BufferedWriter(new OutputStreamWriter(new FileOutputStream(new File(fileName)), StandardCharsets.UTF_8));
        Template template = FreeMarkerUtils.getTemplate("testdemo.ftl");
        // FreeMarker使用Word模板和数据生成Word文档
        try {
            template.process(dataMap, out);
        } catch (TemplateException e) {
            throw new RuntimeException(e);
        }
        out.flush();
        out.close();
    }
遗留问题:关于动态表格的处理,如何根据数据长度来动态调整表格的长度。貌似不能删除单元格和某一列,remove方法没用,只能置空。增加行、列后,单元格内的文本格式调整不生效,例如左对齐,居中等。欢迎评论区解答!
以上就是关于生成word的方法,大致描述了下每种的方法的思路,然后就是在每个过程中有一些注意点,还是比较重要的。也是第一次使用,有不对的地方希望大家多加指教,评论区指出,谢谢!
更多推荐


 0
 0
- 0


 已为社区贡献2条内容

所有评论(0)