
目标检测画图显示图
·
这是我见过最好的代码了,摘录自u版本的yolov3里面的。
首先看画出的效果图:
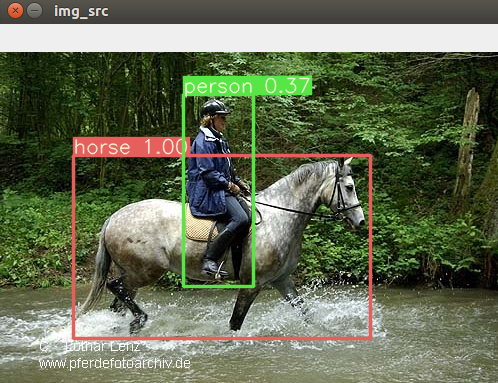
每个类用不同颜色框,上面写出类别和分数这些信息,并且是填充。字体大小能够根据图片大小自动调整。
def plot_one_box(x, img, color=None, label=None, line_thickness=None):
    # Plots one bounding box on image img
    tl = line_thickness or round(0.002 * (img.shape[0] + img.shape[1]) / 2) + 1  # line/font thickness
    color = color or [random.randint(0, 255) for _ in range(3)]
    c1, c2 = (int(x[0]), int(x[1])), (int(x[2]), int(x[3]))
    cv2.rectangle(img, c1, c2, color, thickness=tl, lineType=cv2.LINE_AA)
    if label:
        tf = max(tl - 1, 1)  # font thickness
        t_size = cv2.getTextSize(label, 0, fontScale=tl / 3, thickness=tf)[0]
        c2 = c1[0] + t_size[0], c1[1] - t_size[1] - 3
        cv2.rectangle(img, c1, c2, color, -1, cv2.LINE_AA)  # filled
        cv2.putText(img, label, (c1[0], c1[1] - 2), 0, tl / 3, [225, 255, 255], thickness=tf, lineType=cv2.LINE_AA)


labelmap = (  # always index 0
    'aeroplane', 'bicycle', 'bird', 'boat',
    'bottle', 'bus', 'car', 'cat', 'chair',
    'cow', 'diningtable', 'dog', 'horse',
    'motorbike', 'person', 'pottedplant',
    'sheep', 'sofa', 'train', 'tvmonitor')

colors = [[random.randint(0, 255) for _ in range(3)] for _ in range(len(labelmap))]


....
...
for i in range(detections.size(1)):
    j = 0
    while detections[0, i, j, 0] >= 0.3:
        score = detections[0, i, j, 0]
        idx_class = i-1
        label_name = labelmap[idx_class]
        label_conf = '%s %.2f' % (label_name, score)
        pt = (detections[0, i, j, 1:]*scale).cpu().numpy()
        coords = (pt[0], pt[1], pt[2], pt[3])
        plot_one_box(coords, img_src, label=label_conf, color=colors[idx_class])

        pred_num += 1
        # with open(filename, mode='a') as f:
        #     f.write(str(pred_num)+' label: '+label_name+' score: ' +
        #             str(score) + ' '+' || '.join(str(c) for c in coords) + '\n')
        j += 1

cv2.imshow("img_src",img_src)
cv2.waitKey(0)
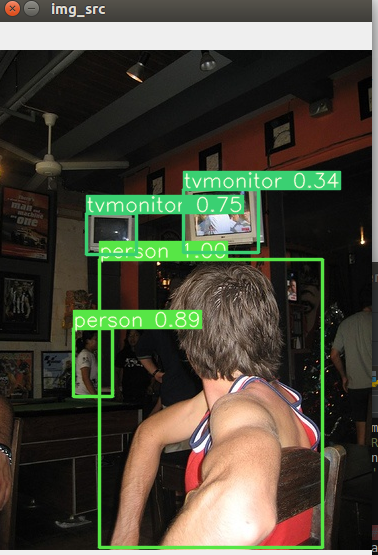
以上是把目标矩形框一个个画出来,最后再显示的。再来一张图
~~2021年07月09日14:41:43~~~~~~~~~~~~~~~~~~~~~~~~~~~~~~~~~~~~~~~~~~~~`
c++实现如下:
static std::string label_map[] =
{
    "label_0",
    "label_1",
    "label_2",
    "label_3",
    "label_4",
    "label_5",
    "label_6",
    "label_7",
    "label_8",
    "label_9",
    "label_10",
    "label_11",
    "label_12",
    "label_13",
    "label_14",
    "label_15"
};

static bool show_rt(const cv::Mat &img, const std::vector<vector<float> > &detections,  std::map<int,cv::Scalar> &lable_colors, const float fth = 0.15)
{
    cv::Mat show = img.clone();
    for (int i = 0; i < detections.size(); ++i)
    {
        const vector<float>& d = detections[i];
        // Detection format: [image_id, label, score, xmin, ymin, xmax, ymax].
        CHECK_EQ(d.size(), 7);
        const float score = d[2];
        const int label = d[1];
        if(score > fth)
        {
            Rect rt = cv::Rect((d[3] * img.cols),(d[4] * img.rows),(d[5] * img.cols - d[3] * img.cols),(d[6] * img.rows - d[4] * img.rows));
            int thickness = int(0.002 * (show.rows + show.cols) / 2) + 1;
            cv::rectangle(show,rt,lable_colors[label],thickness,cv::LINE_AA);
            int tf = std::max(thickness-1,1);
            int baseline = 0;
            cv::Size textSize = cv::getTextSize(label_map[label],0,thickness/3.,tf,&baseline);
            cv::Point pt_tl = rt.tl();
            cv::Point pt_2 = cv::Point(int(pt_tl.x+textSize.width),int(pt_tl.y-textSize.height-3));
            cv::rectangle(show,pt_tl,pt_2,lable_colors[label],-1,cv::LINE_AA);//  filled
            cv::putText(show,label_map[label],cv::Point(pt_tl.x,pt_tl.y-2),0,thickness/3.,cv::Scalar(255,255,255),tf,cv::LINE_AA);
        }
    }

    cv::namedWindow("img_show",0);
    cv::imshow("img_show",show);
    cv::waitKey(0);
    return true;
}


int main(int argc, char** argv)
{
    const string& model_file = "deploy.prototxt";
    const string& weights_file = "net/model/20210709_iter_53919.caffemodel";
    std::ifstream infile("/data_1/list.txt");


    const string& mean_file = FLAGS_mean_file;
    const string& mean_value = FLAGS_mean_value;

    // Initialize the network.
    Detector detector(model_file, weights_file, mean_file, mean_value);

    int num_class = sizeof(label_map)/sizeof(string);
    std::map<int,cv::Scalar> lable_colors;
    for(int i=0;i<num_class;i++)
    {
        int b = rand()%255;
        int g = rand()%255;
        int r = rand()%255;
        lable_colors[i] = cv::Scalar(b,g,r);
    }

    std::string file;
    int cnt = 0;
    while (infile >> file)
    {
        cout << "cnt: " << cnt << "  path="<<file<<endl;
        cnt++;
        cv::Mat img = cv::imread(file, -1);

        long long time_begin;
        long long time_end;
        time_begin = cvGetTickCount();
        std::vector<vector<float> > detections = detector.Detect(img);
        time_end = cvGetTickCount();
        printf("time = %f\n", (time_end - time_begin) / cvGetTickFrequency() / 1000000);

        const float fth = 0.3;
        show_rt(img, detections,lable_colors,fth);
    }

    return 0;
}
更多推荐
 4
4 0
0- 0


 已为社区贡献13条内容

所有评论(0)