
PRS分析在linux上实操
安装最新版PRSice软件:https://choishingwan.github.io/PRSice/
wget https://github.com/choishingwan/PRSice/releases/download/2.3.5/PRSice_linux.zip
下载数据:https://choishingwan.github.io/PRS-Tutorial/prsice/
命令文件介绍
PRSice_linux:二进制文件,直接运行即可。核心计算文件,计算PRS。
PRSice.R:R 脚本文件,主要是绘图可视化,包括bar plot, high-resolution plot和quantile plot
BESE文件:基础数据文件,这里是GWAS summary的结果。包括91063个snp结果。
$ unzip PRSice_linux.zip
PRSice.R TOY_BASE_GWAS.assoc TOY_TARGET_DATA.bed PRSice_linux
TOY_TARGET_DATA.bim TOY_TARGET_DATA.fam TOY_TARGET_DATA.pheno
$ unzip post-qc.zip
Height.QC.gz EUR.QC.bed EUR.QC.bim EUR.QC.fam EUR.height
EUR.cov EUR.eigenvec
运行代码:
Rscript PRSice.R --dir . --prsice ./PRSice_linux \
--base TOY_BASE_GWAS.assoc \
--target TOY_TARGET_DATA \
--thread 4 \
--stat OR \
--binary-target T
代码解释:Rscript,是用R语言进行操作
--dir,默认是当前路径
--prsice,指定PRSice的执行文件
--base,是基础数据,这里是GWAS的结果,TOY_BASE_GWAS.assoc
--target,这里是plink的二进制文件,前缀名
--thread 1,用1个线程
--stat OR,这里用的是OR值(二分类性状的OR值,连续性状是Beta值)
--binary-target T,用的是二分类性状,连续性状用的是F
运行结果:
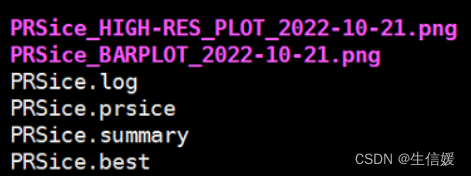
结果解释:
PRSice.price文件——该文件,主要是根据不同Threshold阈值后,选择的SNP个数(Num_SNP)以及对应的解释度(R2)等信息。
Pheno Set Threshold R2 P Coefficient Standard.Error Num_SNP
- Base 0.00025005 0.0133696 8.43169e-06 -0.197266 0.0442903 2
- Base 0.00030005 0.00824473 0.000456434 -0.225204 0.0642503 3
- Base 0.00040005 0.0089725 0.000256089 -0.350267 0.0958035 5
- Base 0.00045005 0.0101339 0.000102845 -0.445497 0.114707 6
- Base 0.00065005 0.00532975 0.004775 -0.402003 0.142462 8
- Base 0.00070005 0.00876654 0.00030122 -0.549246 0.151967 9
- Base 0.00080005 0.00233607 0.061455 -0.369219 0.197422 13
- Base 0.00085005 0.00153157 0.129826 -0.342923 0.226384 15
- Base 0.00095005 0.000124324 0.665873 -0.100725 0.233258 16
PRSice.best文件——这个文件,是每个个体,计算的PRS值
FID IID In_Regression PRS
CAS_1 CAS_1 Yes -0.00599501328
CAS_2 CAS_2 Yes -0.00631017938
CAS_3 CAS_3 Yes -0.00227495325
CAS_4 CAS_4 Yes -0.00204360007
CAS_5 CAS_5 Yes -0.000830676955
CAS_6 CAS_6 Yes -0.00224943517
CAS_7 CAS_7 Yes -0.000687589983
CAS_8 CAS_8 Yes -0.00413102565
CAS_9 CAS_9 Yes 0.00256661049
PRSice.summy文件——这个文件,是给出最优模型的结果,比如适合的SNP个数,R2,回归系数,P值等信息。
$head PRSice.summary
Phenotype Set Threshold PRS.R2 Full.R2 Null.R2 Prevalence Coefficient Standard.Error P Num_SNP
- Base 0.4463 0.0520082 0.0520082 0 - 86.288 9.96331 4.69368e-18 36759
PRSice_BARPLOT_*.png:这个柱形图,是应用比较广泛的图,X坐标是不同P值,Y坐标是PRS风险得分的解释百分比(R2),柱形图最高的点表示该模型最优,比如下面图中,在P值为0.4463时,模型最优,解释的百分比是5%左右,P值为4.7e-18,极显著。

PRSice_HIGH-RES_PLOT_*.png:下图X坐标是不同的P阈值,Y坐标是显著性(-log转化),可以看到最显著的P的阈值是在 0.5 左 右 。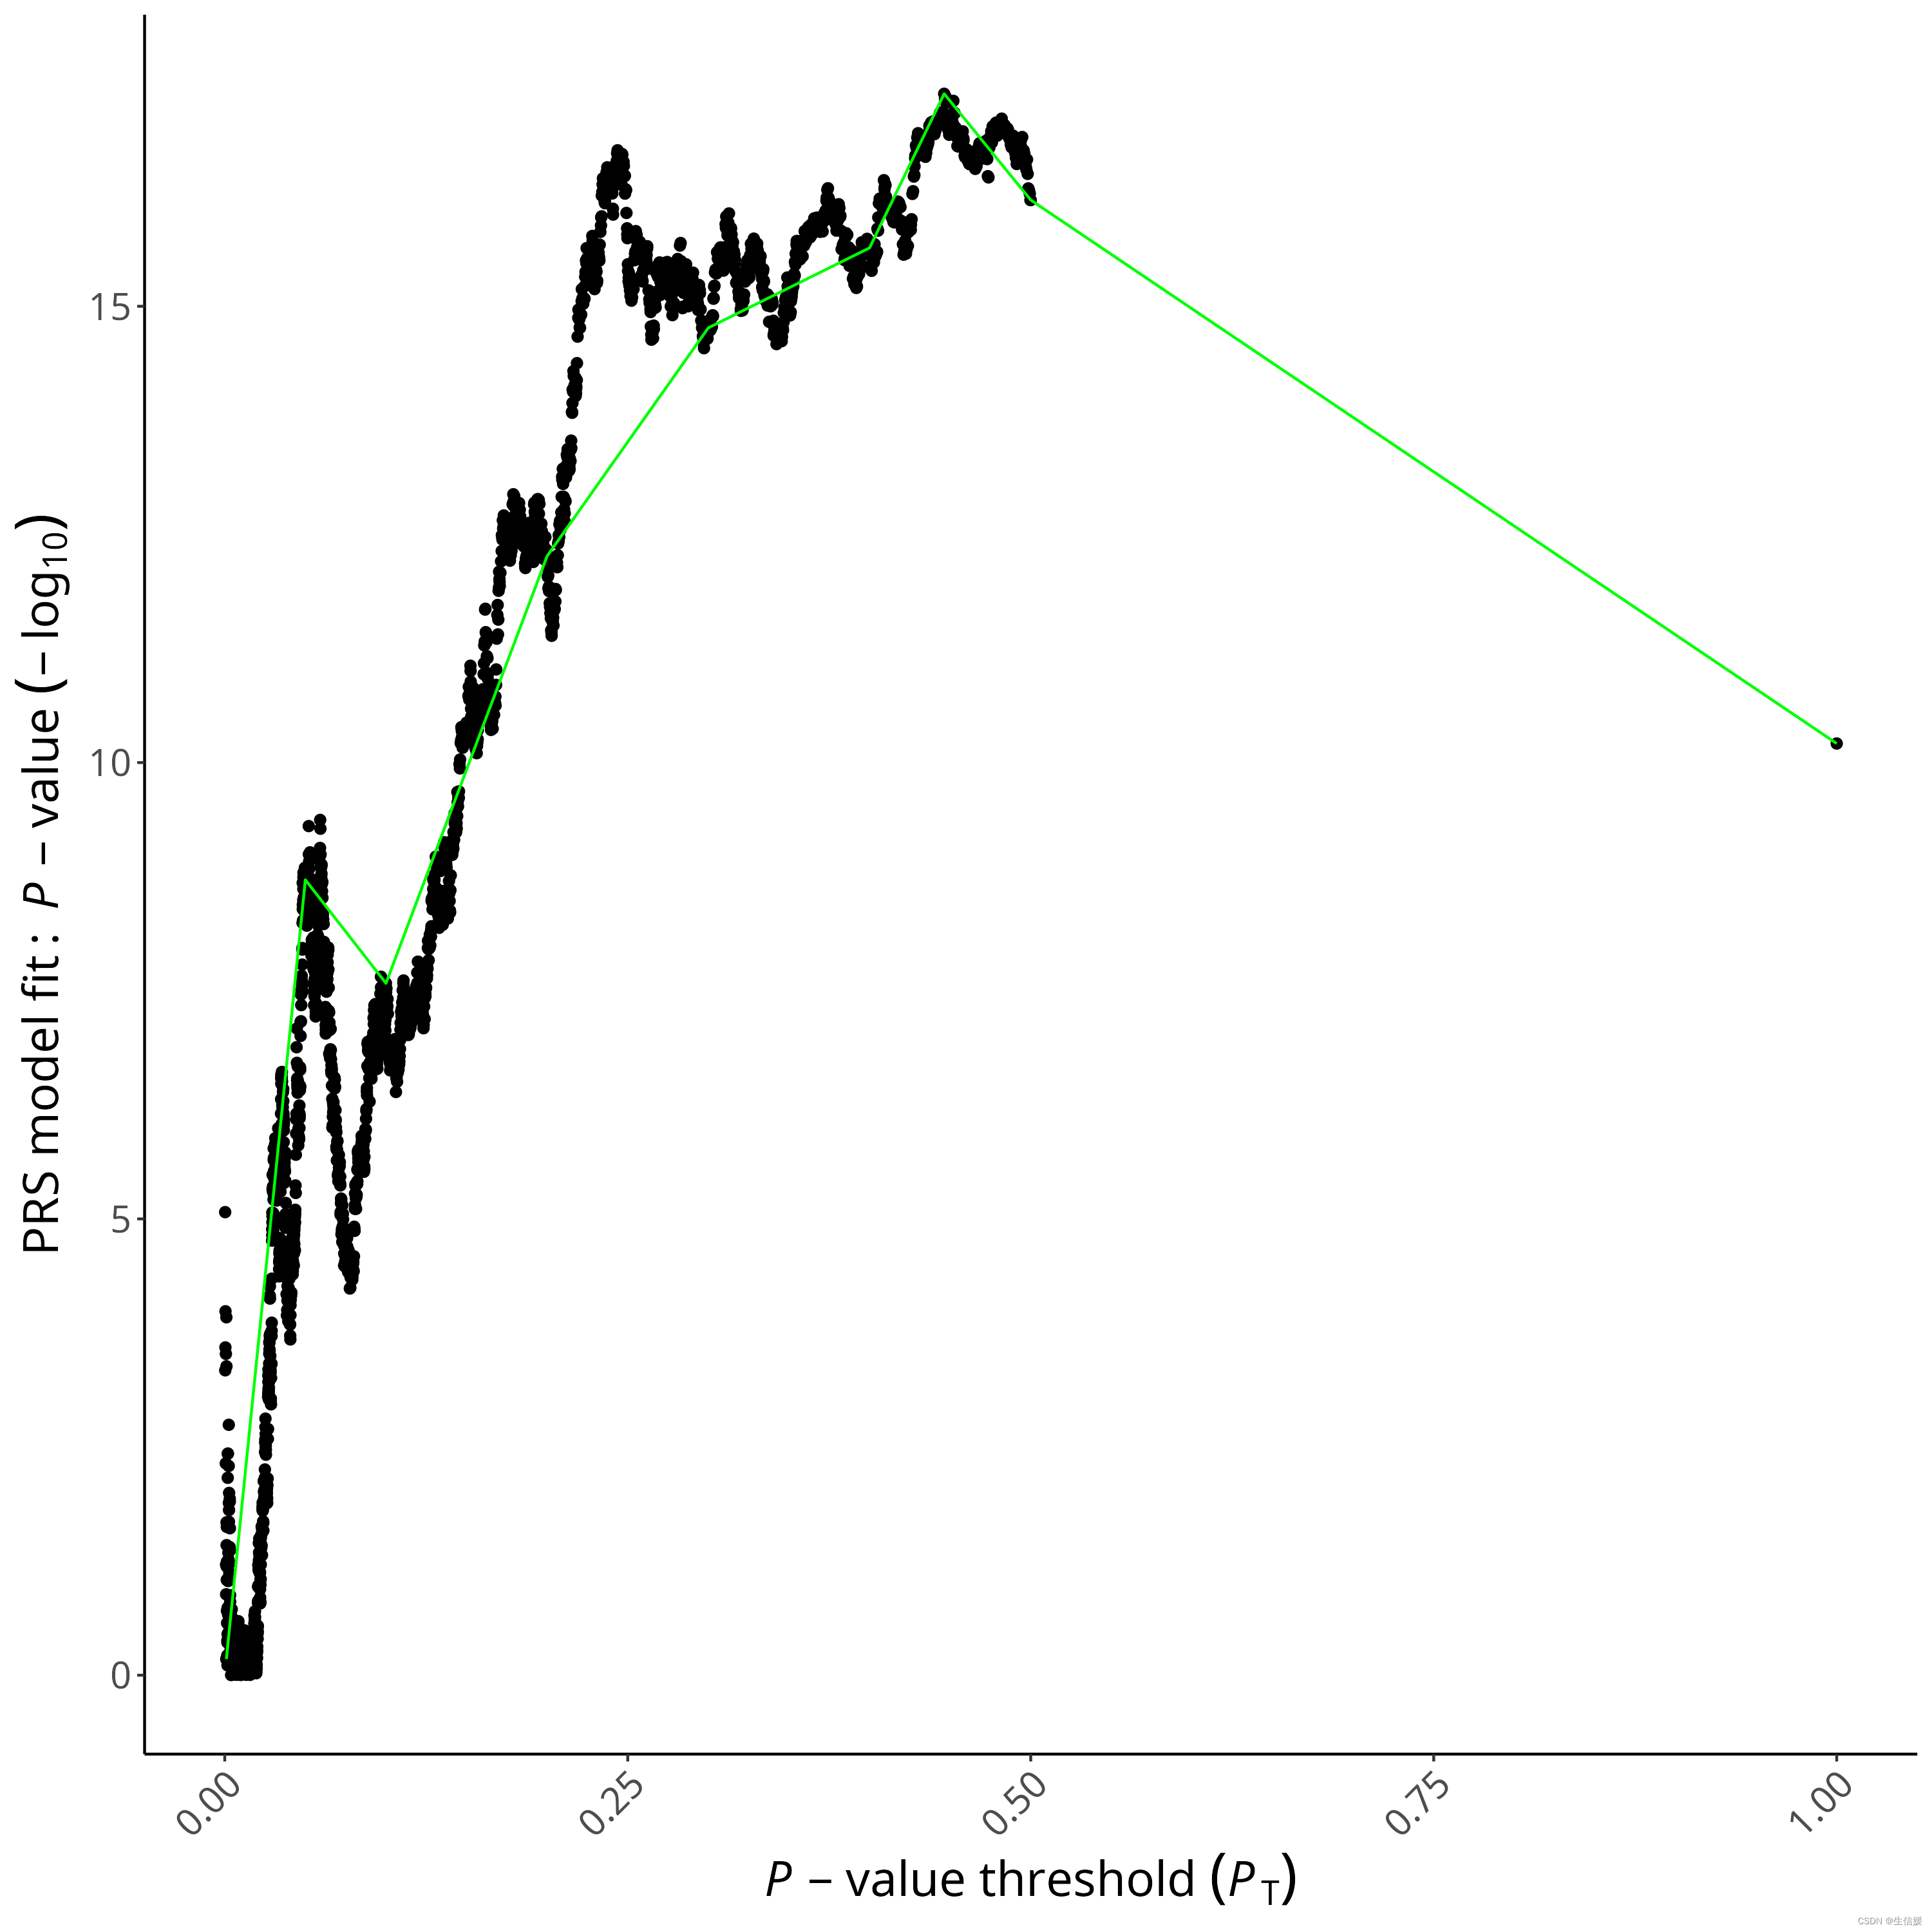
更多推荐


 0
 0
- 0


 已为社区贡献3条内容

所有评论(0)